Data importing and tidy data I

Quantitative Methods for
International Politics

IPOL 3270 • Fall 2026

September 20, 2026

Plan for today

Types of variables

Describing variables

Types of variables

Variables and observations

Observations

A value that is recorded about something

Variables

A set of observations about the same thing

                  name height_cm
1       Mariah Moncada       170
2           Hibaq Haro       172
3  Manaahil al-Bacchus       182
4        Kadi Kusupati       178
5      Ghaazi el-Tamer       170
6      Thanaa al-Mitri       155
7      Emilio Martinez       174
8     Jawhar al-Meskin       169
9      Iyaad al-Khalaf       171
10   Sabiyya el-Halaby       183

Observations

Mariah Moncada; 170

Variables

Name; height

Unit of observation

A person

Variables and observations

Observations

A value that is recorded about something

Variables

A set of observations about the same thing

   country year refugees_accepted
1    Egypt 2021            280686
2    Egypt 2022            294632
3    Egypt 2023            240507
4    Egypt 2024            238014
5   France 2021            499914
6   France 2022            612934
7   France 2023            664366
8   France 2024            721771
9  Germany 2021           1255694
10 Germany 2022           2075445
11 Germany 2023           2593007
12 Germany 2024           2749266

Observations

Egypt; 2021; 280,686

Variables

Country; year; refugees accepted

Unit of observation

Country year

General types of variables

Identification variables

Values that identify observations

Measurement variables

Values that describe the observations

  faa                                name     lat       lon  alt tz dst
1 AAF       Apalachicola Regional Airport 29.7275  -85.0275   20 -5   A
2 AAP                      Andrau Airpark 29.7225  -95.5883   79 -6   A
3 ABE Lehigh Valley International Airport 40.6521  -75.4408  393 -5   A
4 ABI            Abilene Regional Airport 32.4113  -99.6819 1791 -6   A
5 ABL                      Ambler Airport 67.1063 -157.8570  334 -9   A
6 ABQ   Albuquerque International Sunport 35.0402 -106.6090 5355 -7   A
7 ABR           Aberdeen Regional Airport 45.4491  -98.4218 1302 -6   A
8 ABY  Southwest Georgia Regional Airport 31.5355  -84.1945  197 -5   A

Identification: faa, name
Measurement: lat, lon, alt, tz, dst

Identification vs. measurement

Identification variables uniquely identify each observation

Unit of observation = what each row represents

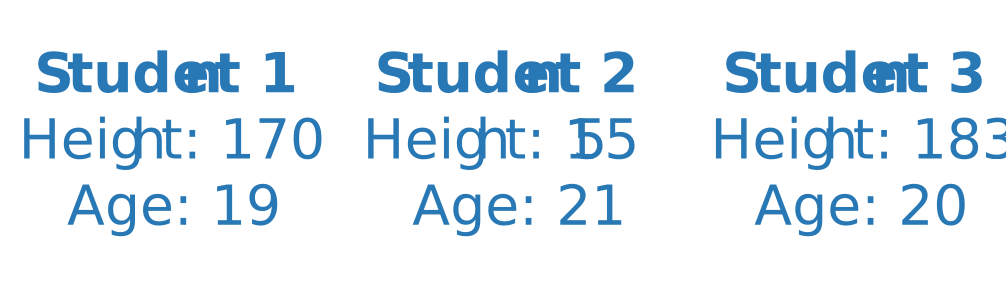
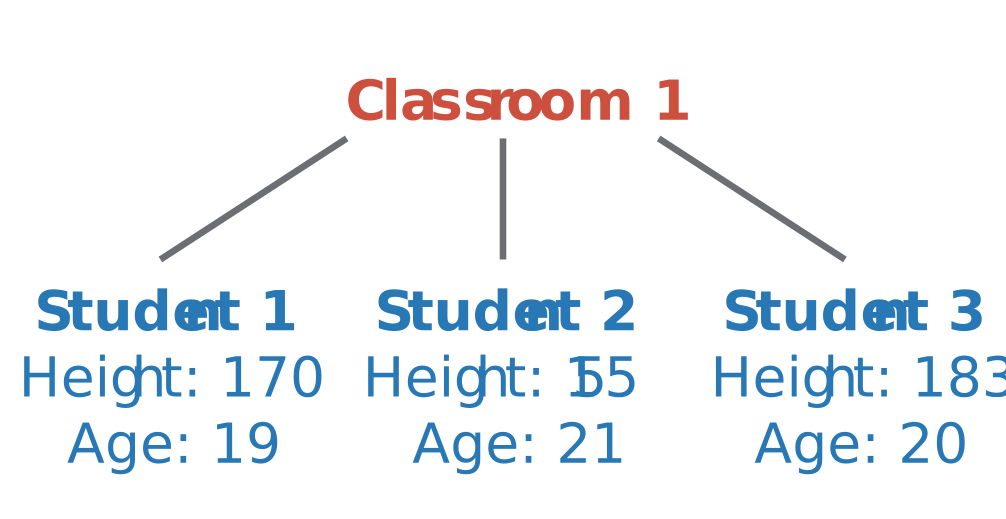
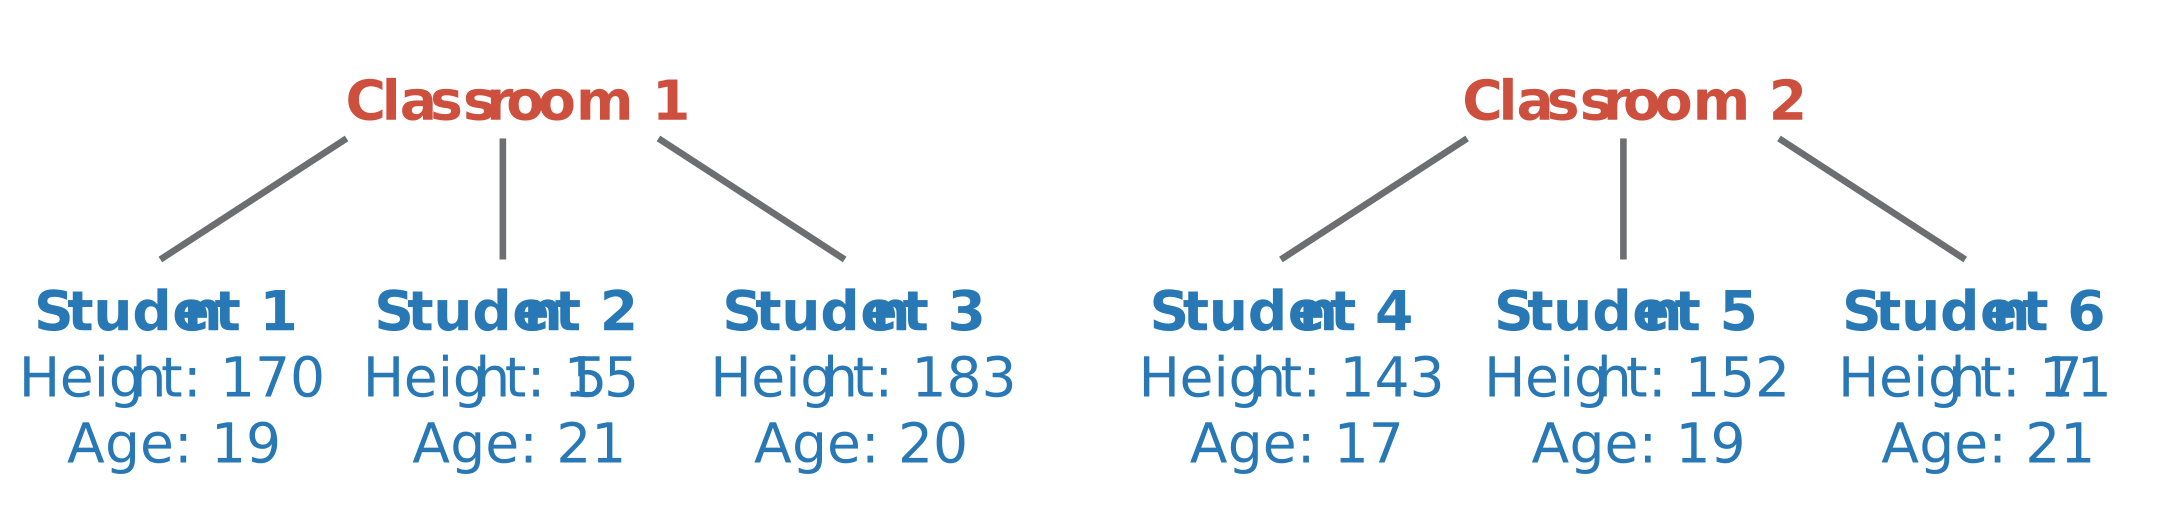
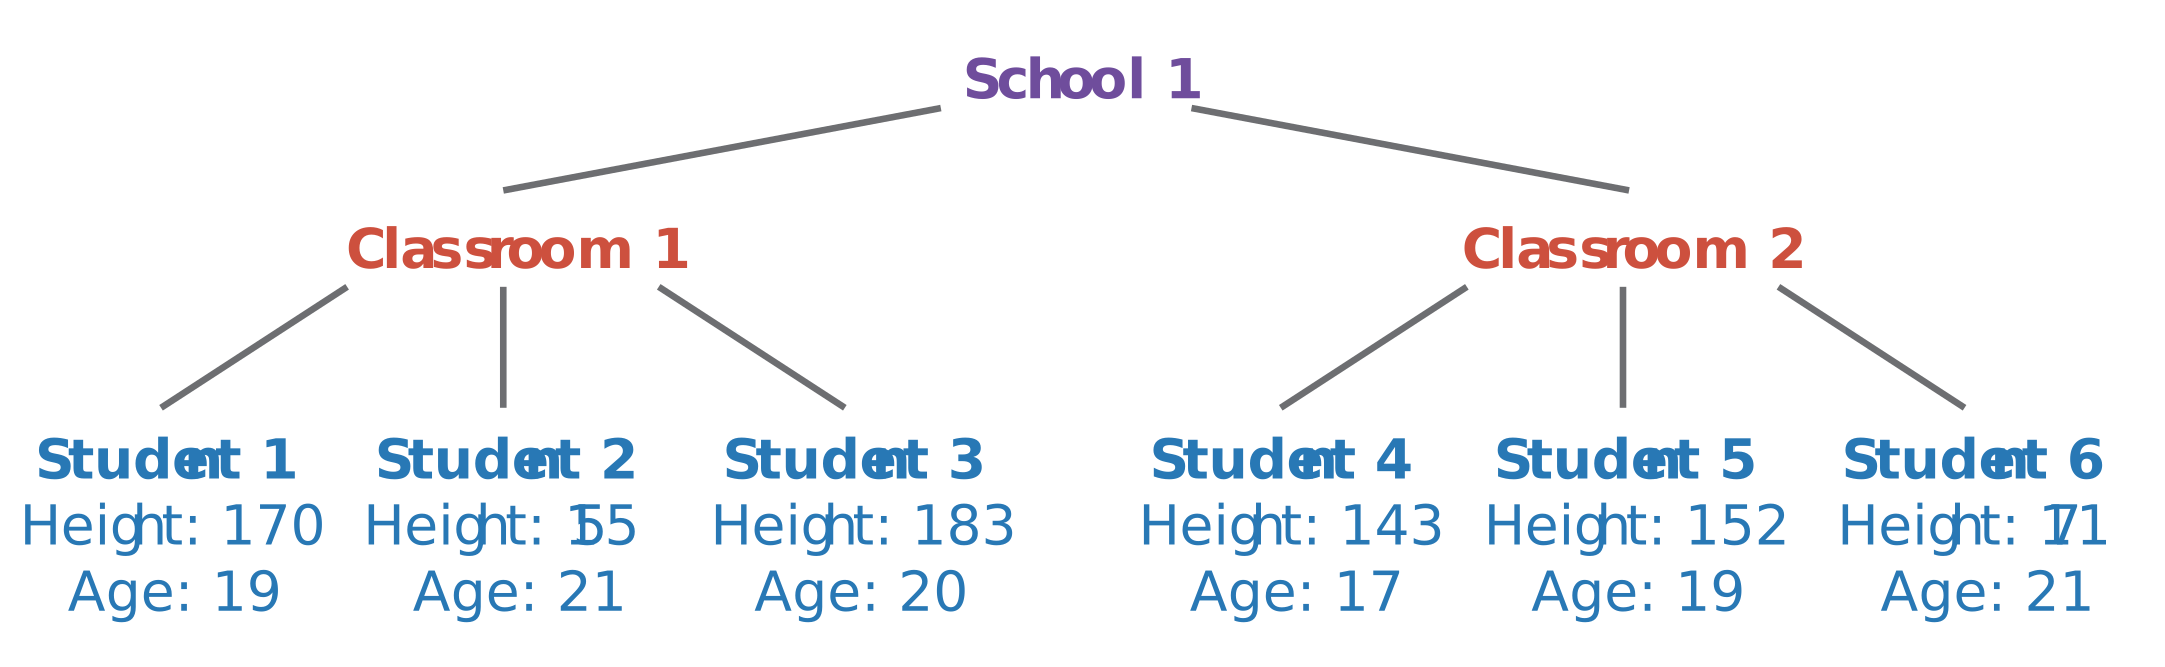
Think of a hierarchy!

General types of variables

Identification variables

Values that identify observations

Measurement variables

Values that describe the observations

      country continent year lifeExp      pop gdpPercap
1 Afghanistan      Asia 1952  28.801  8425333  779.4453
2 Afghanistan      Asia 1957  30.332  9240934  820.8530
3 Afghanistan      Asia 1962  31.997 10267083  853.1007
4 Afghanistan      Asia 1967  34.020 11537966  836.1971
5 Afghanistan      Asia 1972  36.088 13079460  739.9811
6 Afghanistan      Asia 1977  38.438 14880372  786.1134
7 Afghanistan      Asia 1982  39.854 12881816  978.0114
8 Afghanistan      Asia 1987  40.822 13867957  852.3959

Identification: country, year (continent?)
Measurement: lifeExp, pop, gdpPercap (continent?)

Your turn!

What would these datasets look like?

  • The height, age, and GPA of each student in this class
  • The height, age, and GPA of each student in this class in their freshman, sophomore, junior, and senior years
  • The population and GDP of GCC countries in 2026
  • The population and GDP of GCC countries each year from 2020 to 2026

Types of measurement variables

Numeric

Continuous variables

Numbers: values from
−∞ to ∞

Monthly income, duration of an exam, GDP

Count variables

Counts: values that are whole and not negative

Population, number of civil wars, number of students in a class

Often treated like continuous

Types of measurement variables

Categories

Categorical variables

Race, religion, continent, highest level of education, color of flower, species of penguin

Binary variables

Two categories only

  • Person served in military?
  • Country faced civil war?
  • Country voted for UN resolution?
  • Penguin is heavier than 3 kg?

Ordinal variables

Ordered categories

  • Species of penguin (Adelie, Chinstrap, Gentoo)
  • County income level (low, medium, high)
  • Agreement with a survey question (Likert scale disagree → neutral → agree)
  • Highest education completed (primary school, high school, university, graduate school)

Types of measurement variables

Qualitative data

Qualitative variables

Stuff that’s not numeric and not categorical

  • Survey free response fields
  • Pictures and videos
  • Newspaper headlines

Types of measurement variables

Numeric

Continuous

Count

Categorical

Categorical

Binary

Ordinal

Qualitative

Qualitative

Your turn!

What kind of variables are these?

  • Temperature
  • Number of goals scored in a World Cup match
  • Did country hold an election this year?
  • Olympic medal type (gold/silver/bronze)
  • Interview transcripts
  • Grade in a class (A–F)
  • Grade on an exam (0-100)
  • Blood type
  • Religion
  • Military rank
  • Political party of head of state
  • Did a law pass?
  • Slogans on protest signs
  • Number of siblings
  • Distance traveled
  • QAR to EUR exchange rate

Describing variables

Why do we even care??

Most of data analysis is really just describing variables

We can describe variables with numbers and pictures

A variable’s type determines which numbers and pictures you can use

Describing numbers with numbers

Summary statistics

  • Mean: add up all the numbers, divide by the count
  • Median: the middle number of the variable
  • Minimum and Maximum: the smallest and biggest numbers
  • Percentiles: how many other observations are below certain numbers (25th percentile, 75th percentile, 90th percentile, etc)
  • Standard deviation: how much numbers are spread out from the mean

gapminder |> 
  filter(year == 2007) |> 
  summarize(
    avg_gdp = mean(gdpPercap),
    median_gdp = median(gdpPercap),
    min_gdp = min(gdpPercap),
    max_gdp = max(gdpPercap),
    pct_25 = quantile(gdpPercap, probs = 0.25),
    pct_75 = quantile(gdpPercap, probs = 0.75),
    sd_gdp = sd(gdpPercap)
  )
# A tibble: 1 × 7
  avg_gdp median_gdp min_gdp max_gdp pct_25 pct_75 sd_gdp
    <dbl>      <dbl>   <dbl>   <dbl>  <dbl>  <dbl>  <dbl>
1  11680.      6124.    278.  49357.  1625. 18009. 12860.

library(moderndive)

gapminder |> 
  filter(year == 2007) |> 
  tidy_summary(gdpPercap)
# A tibble: 1 × 11
  column        n group type      min    Q1   mean median     Q3    max     sd
  <chr>     <int> <chr> <chr>   <dbl> <dbl>  <dbl>  <dbl>  <dbl>  <dbl>  <dbl>
1 gdpPercap   142 <NA>  numeric  278. 1625. 11680.  6124. 18009. 49357. 12860.

Describing numbers with plots

Distributions

  • Histograms
  • Density plots
  • Boxplots
  • Dot plots
  • Raincloud plots

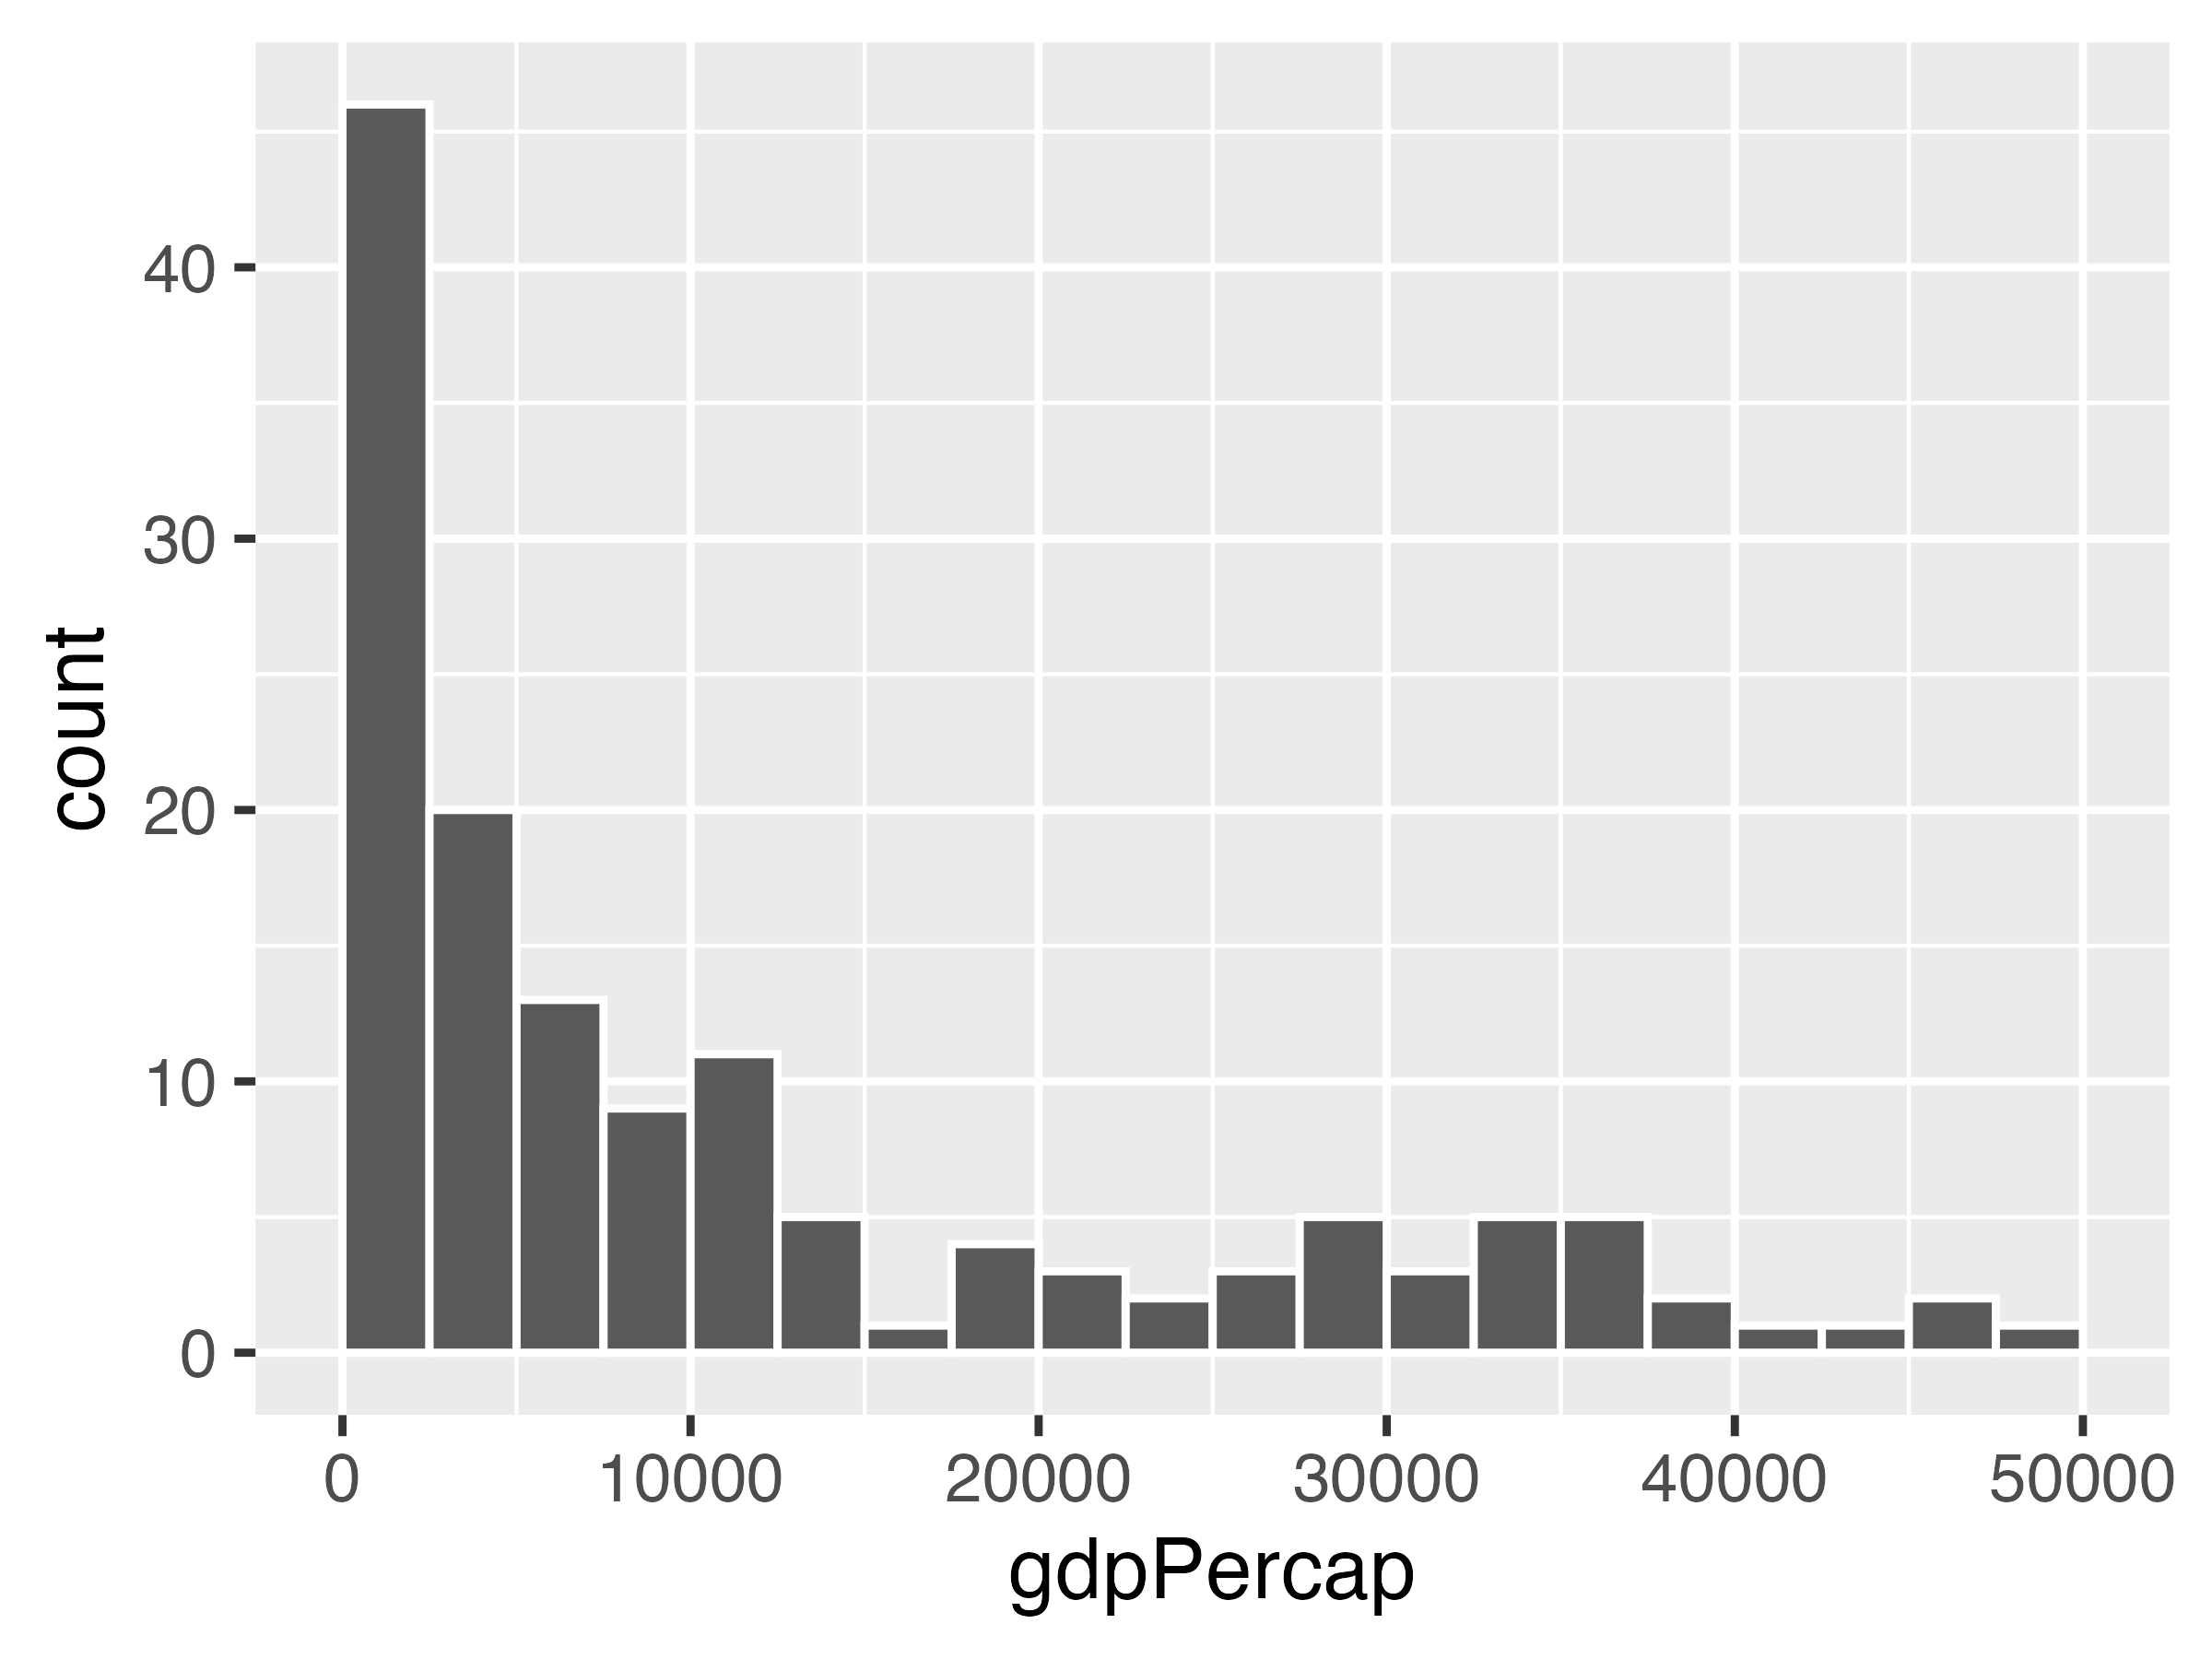
Histogram

gapminder |>
  filter(year == 2007) |>
  ggplot(aes(x = gdpPercap)) +
  geom_histogram(
    color = "white",
    binwidth = 2500,
    boundary = 0
  )
Density plot

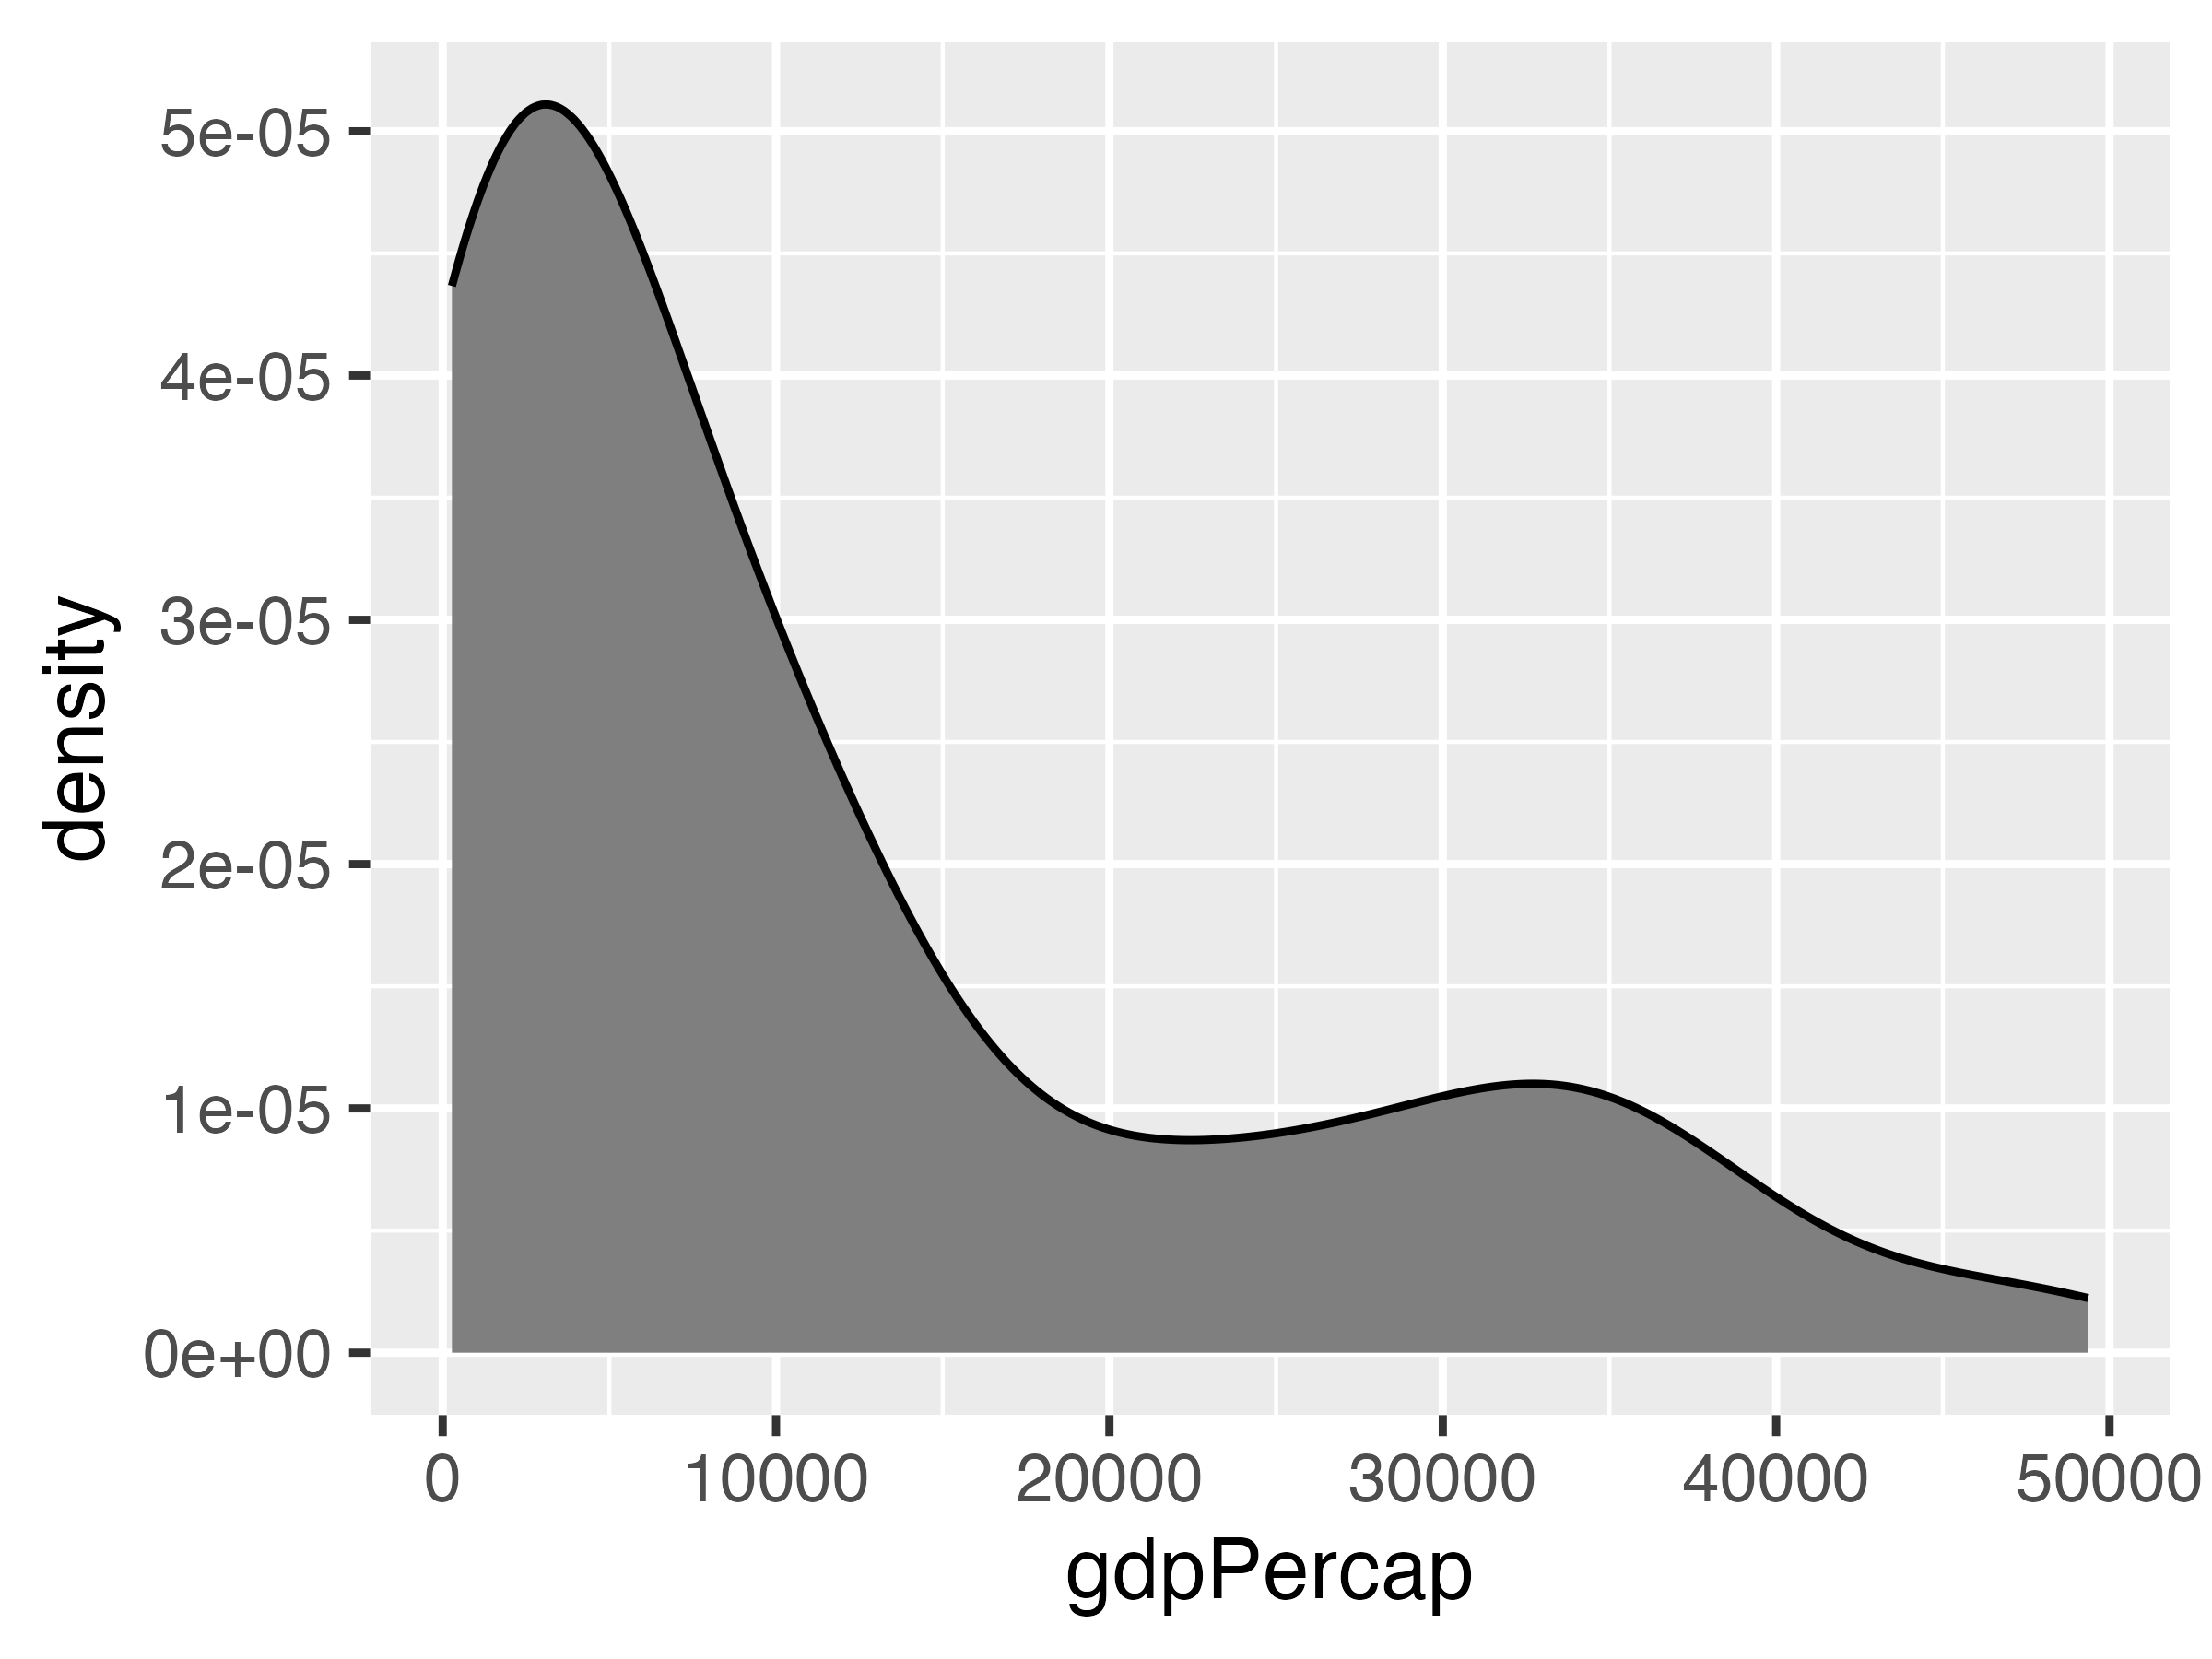
gapminder |>
  filter(year == 2007) |>
  ggplot(aes(x = gdpPercap)) +
  geom_density(fill = "grey50")
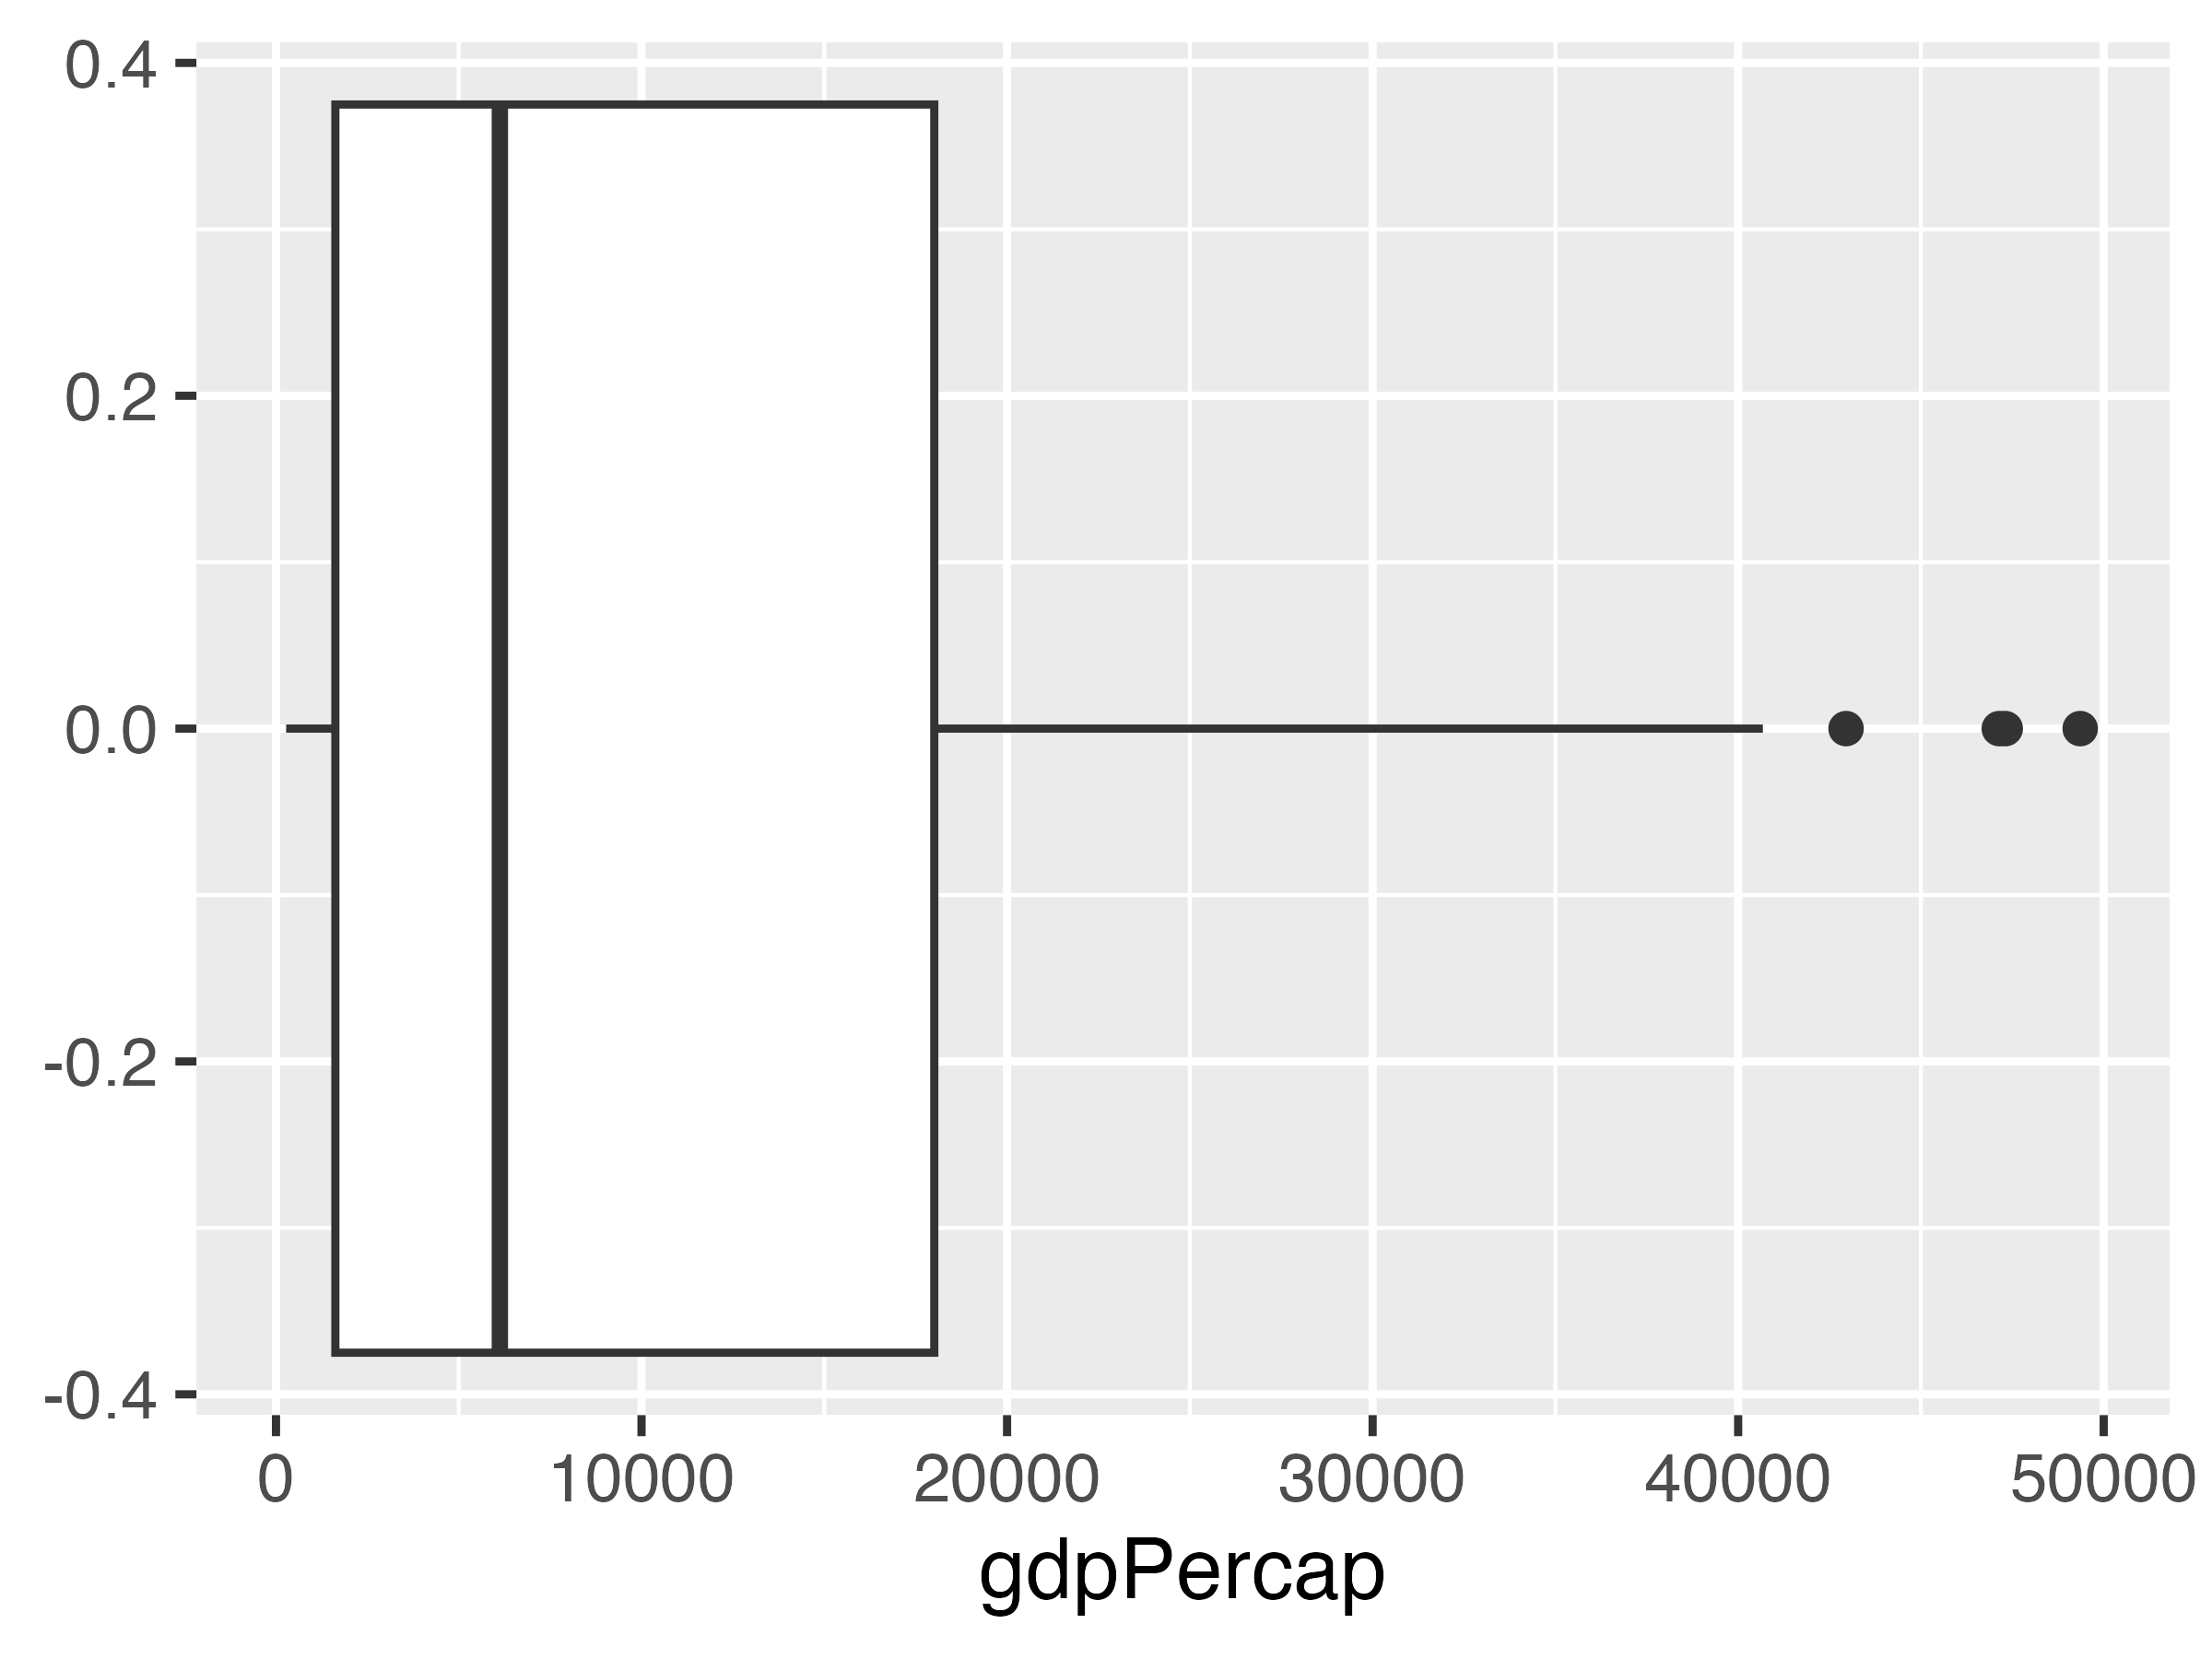
Boxplot

gapminder |>
  filter(year == 2007) |>
  ggplot(aes(x = gdpPercap)) +
  geom_boxplot()
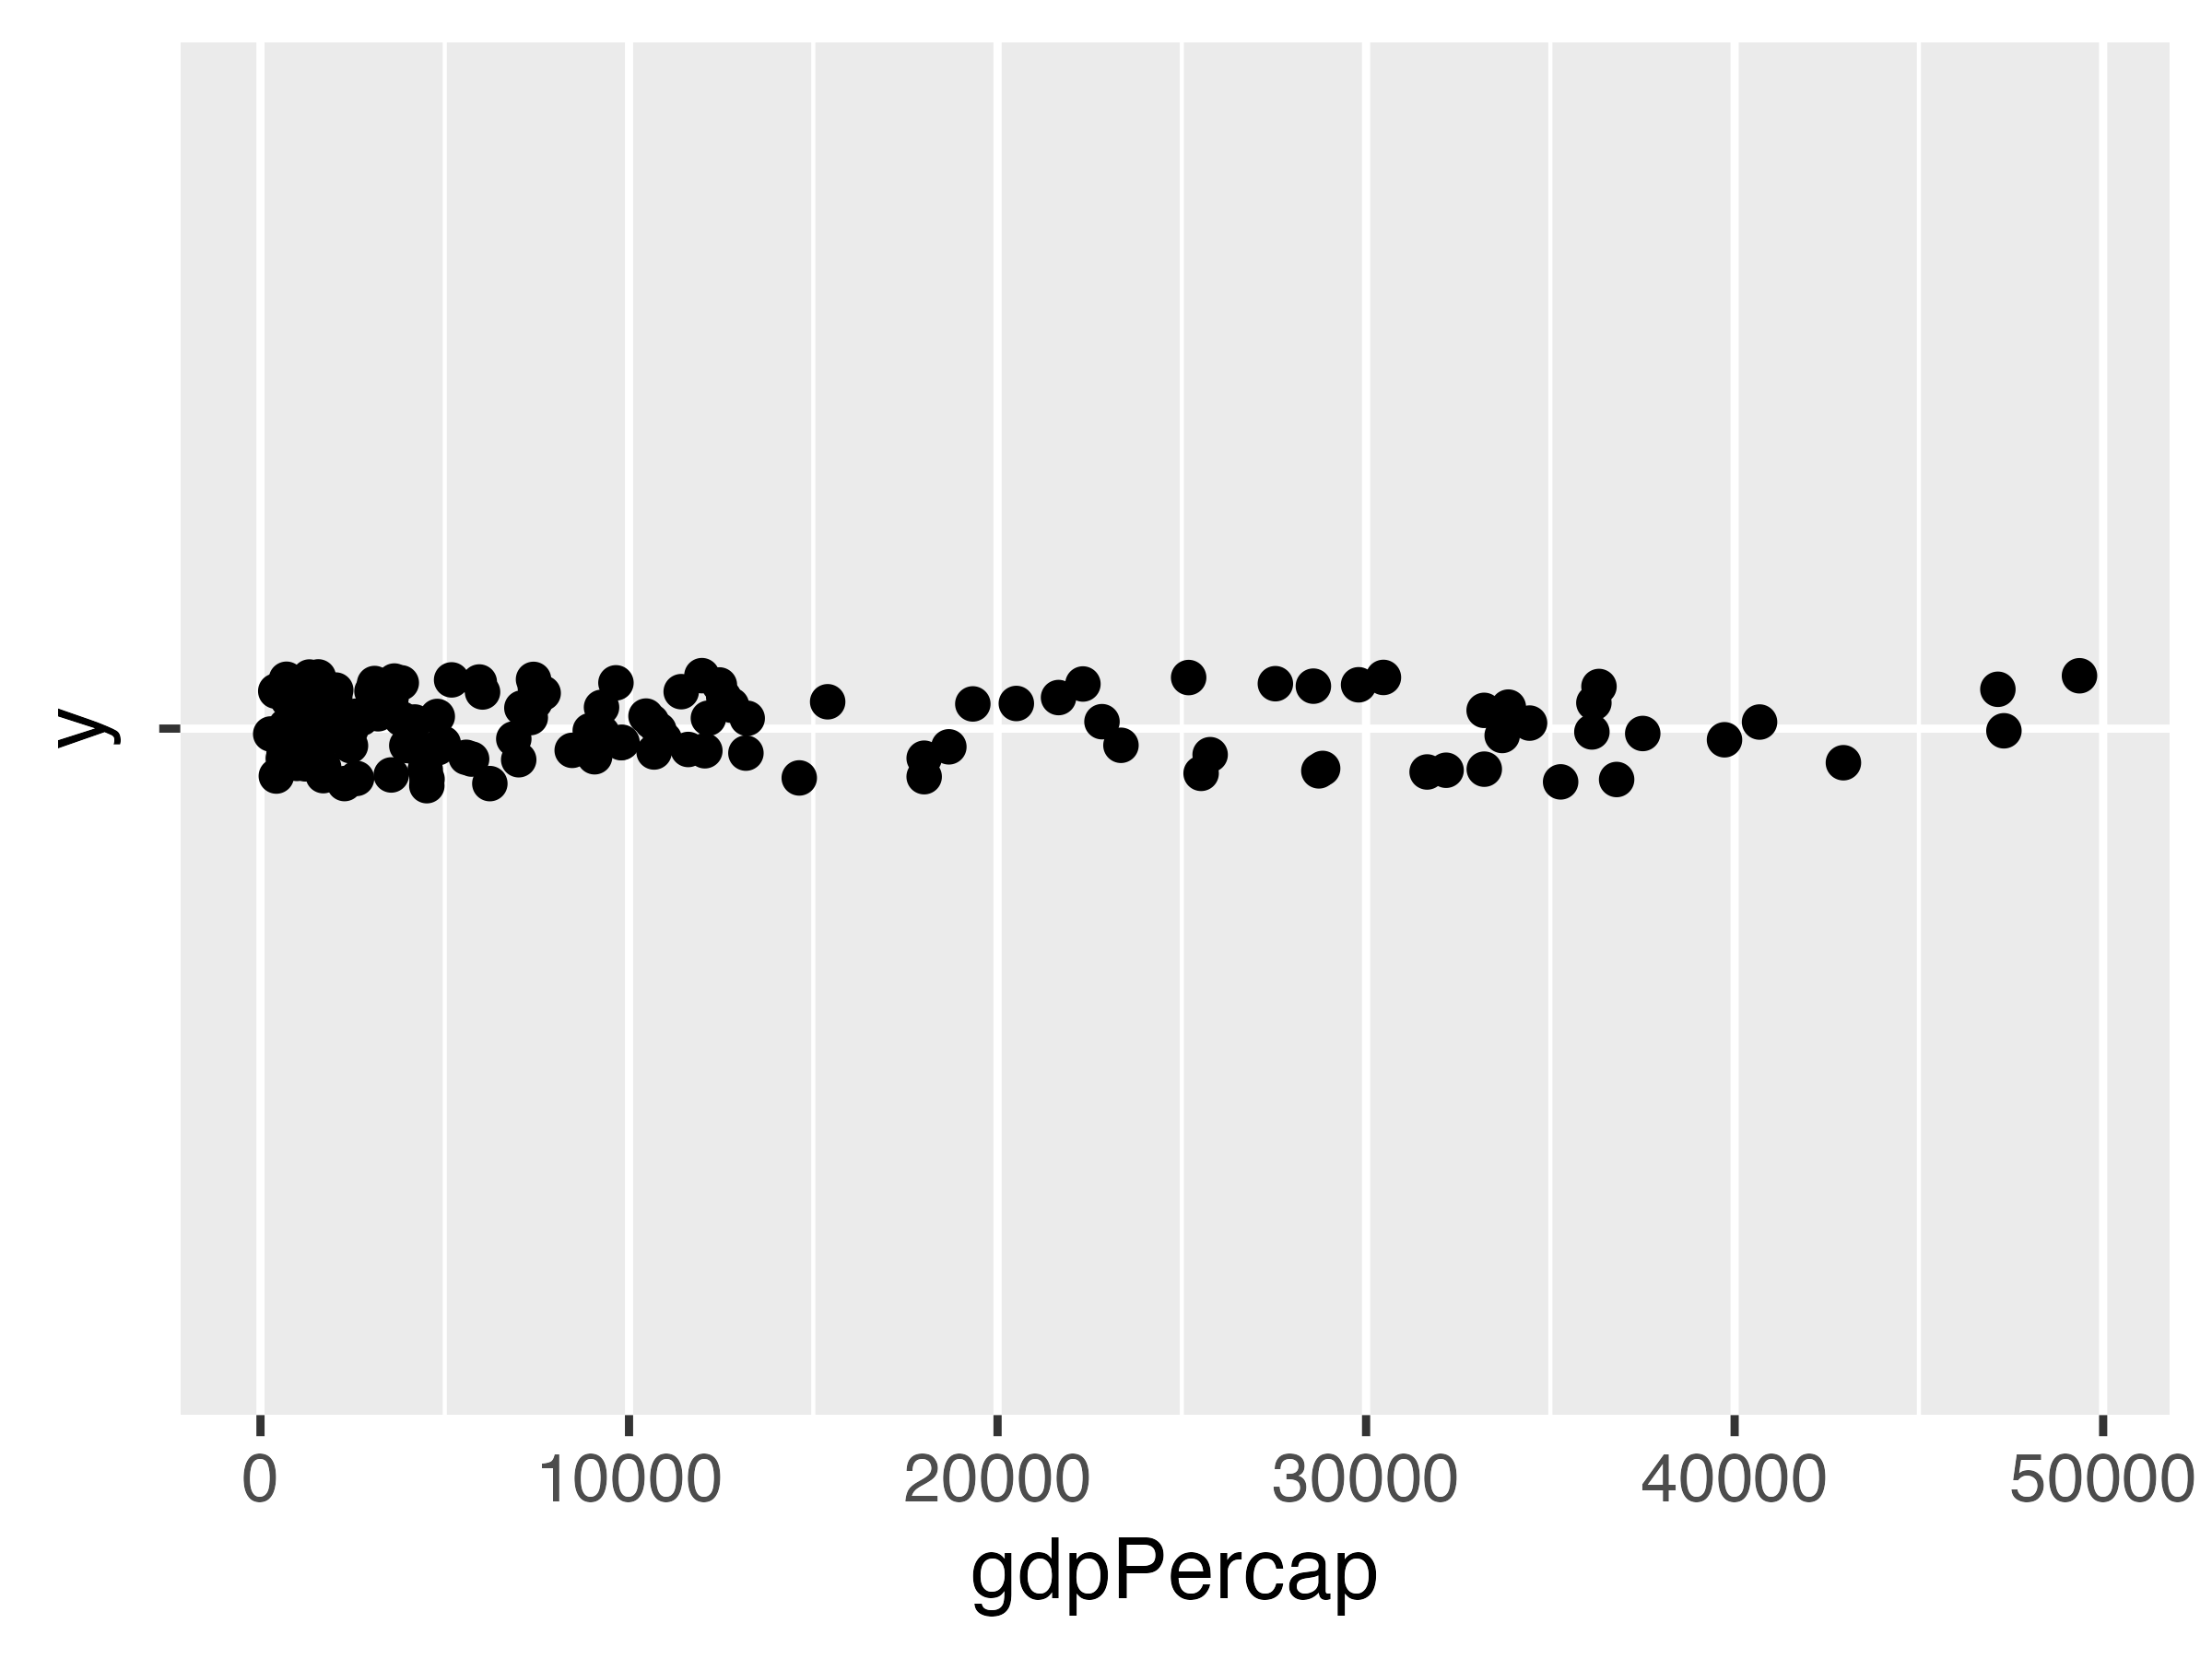
Dot plot

gapminder |>
  filter(year == 2007) |>
  ggplot(
    aes(x = gdpPercap, y = "")
  ) +
  geom_point(
    position = position_jitter(
      width = 0,
      height = 0.05
    )
  )
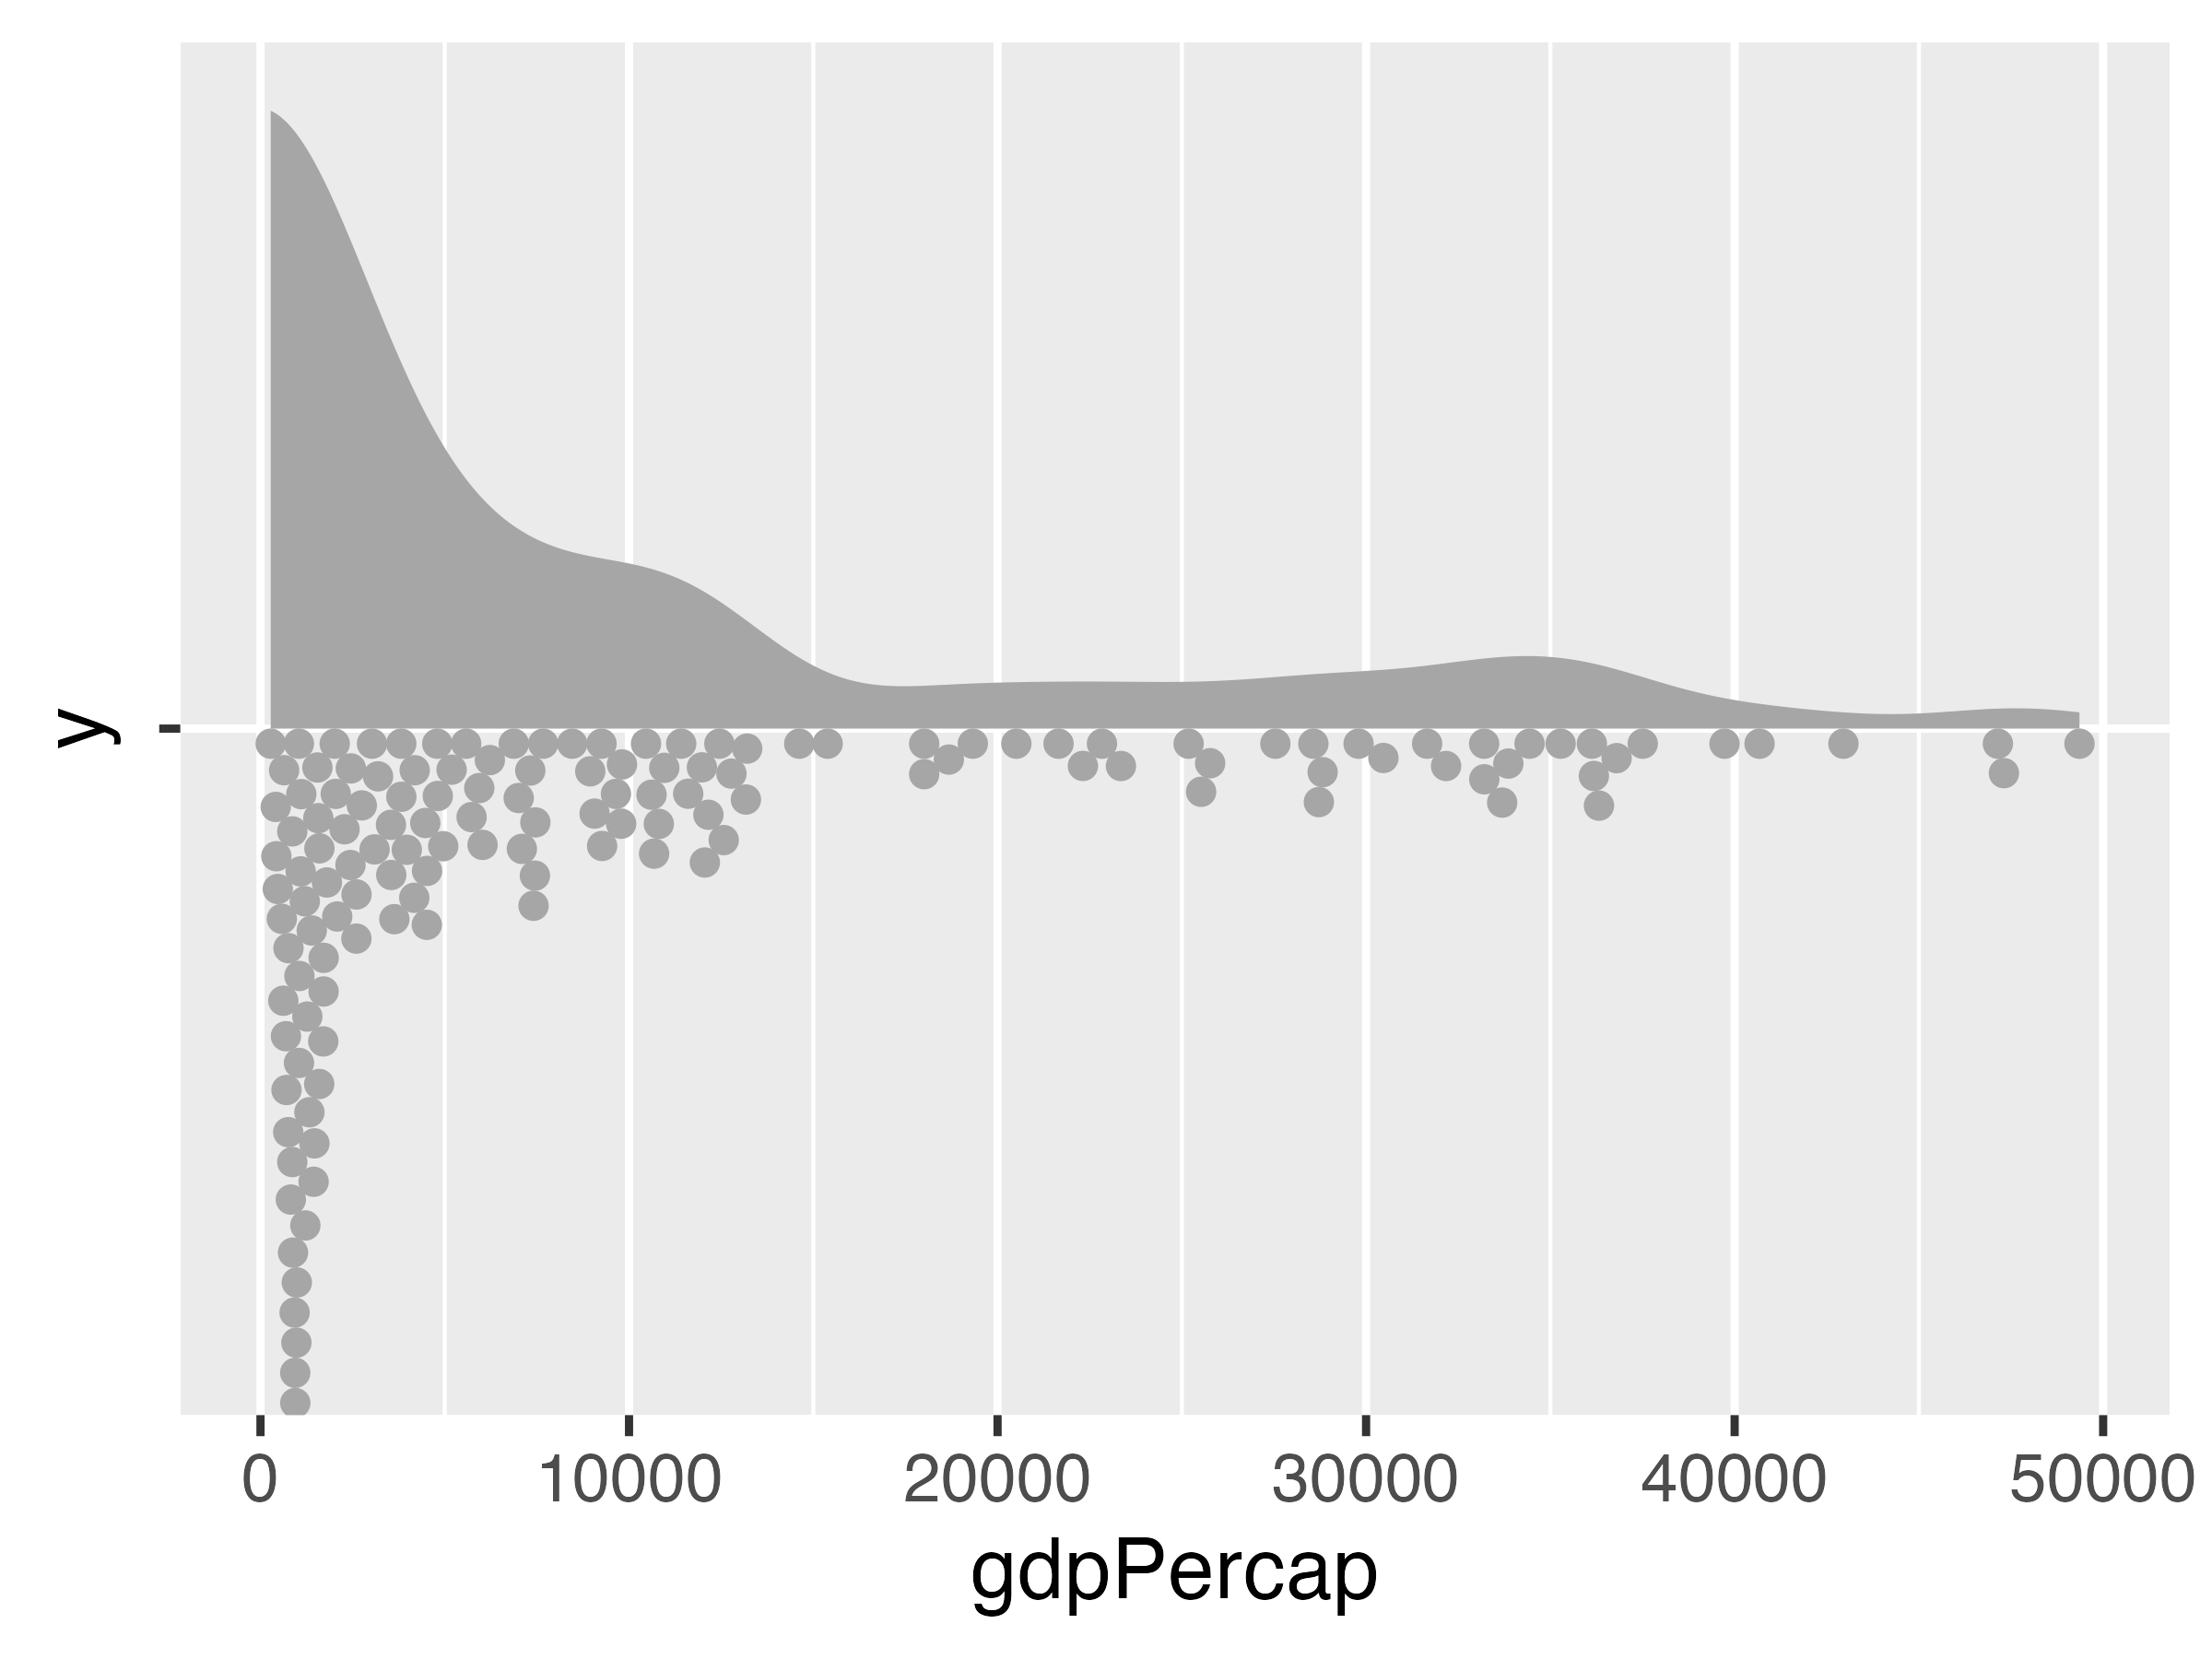
Raincloud plot

library(ggdist)

gapminder |>
  filter(year == 2007) |>
  ggplot(
    aes(x = gdpPercap, y = "")
  ) +
  stat_slab(
    side = "top",
    color = NA
  ) +
  stat_dots(
    side = "bottom",
    layout = "swarm"
  )
Describing categorical variables

     species    island body_mass bill_len
1     Adelie     Dream      3475     40.6
2     Adelie    Biscoe      3500     39.6
3     Gentoo    Biscoe      5050     45.0
4     Gentoo    Biscoe      5700     49.8
5     Gentoo    Biscoe      5800     49.5
6     Adelie     Dream      4000     41.5
7  Chinstrap     Dream      4800     52.0
8     Adelie     Dream      3400     34.0
9     Adelie Torgersen      3700     35.5
10    Gentoo    Biscoe      5650     54.3

What’s the average species?

What’s the maximum island?

Not possible!

Regular summary statistics don’t work with categorical data!

Describing categories

Summary statistics

  • Counts: Count each category
  • Proportions: Find the proportion of each category relative to something else (total, another category, etc.)

Plots

  • Bar plots
  • Lollipop plots
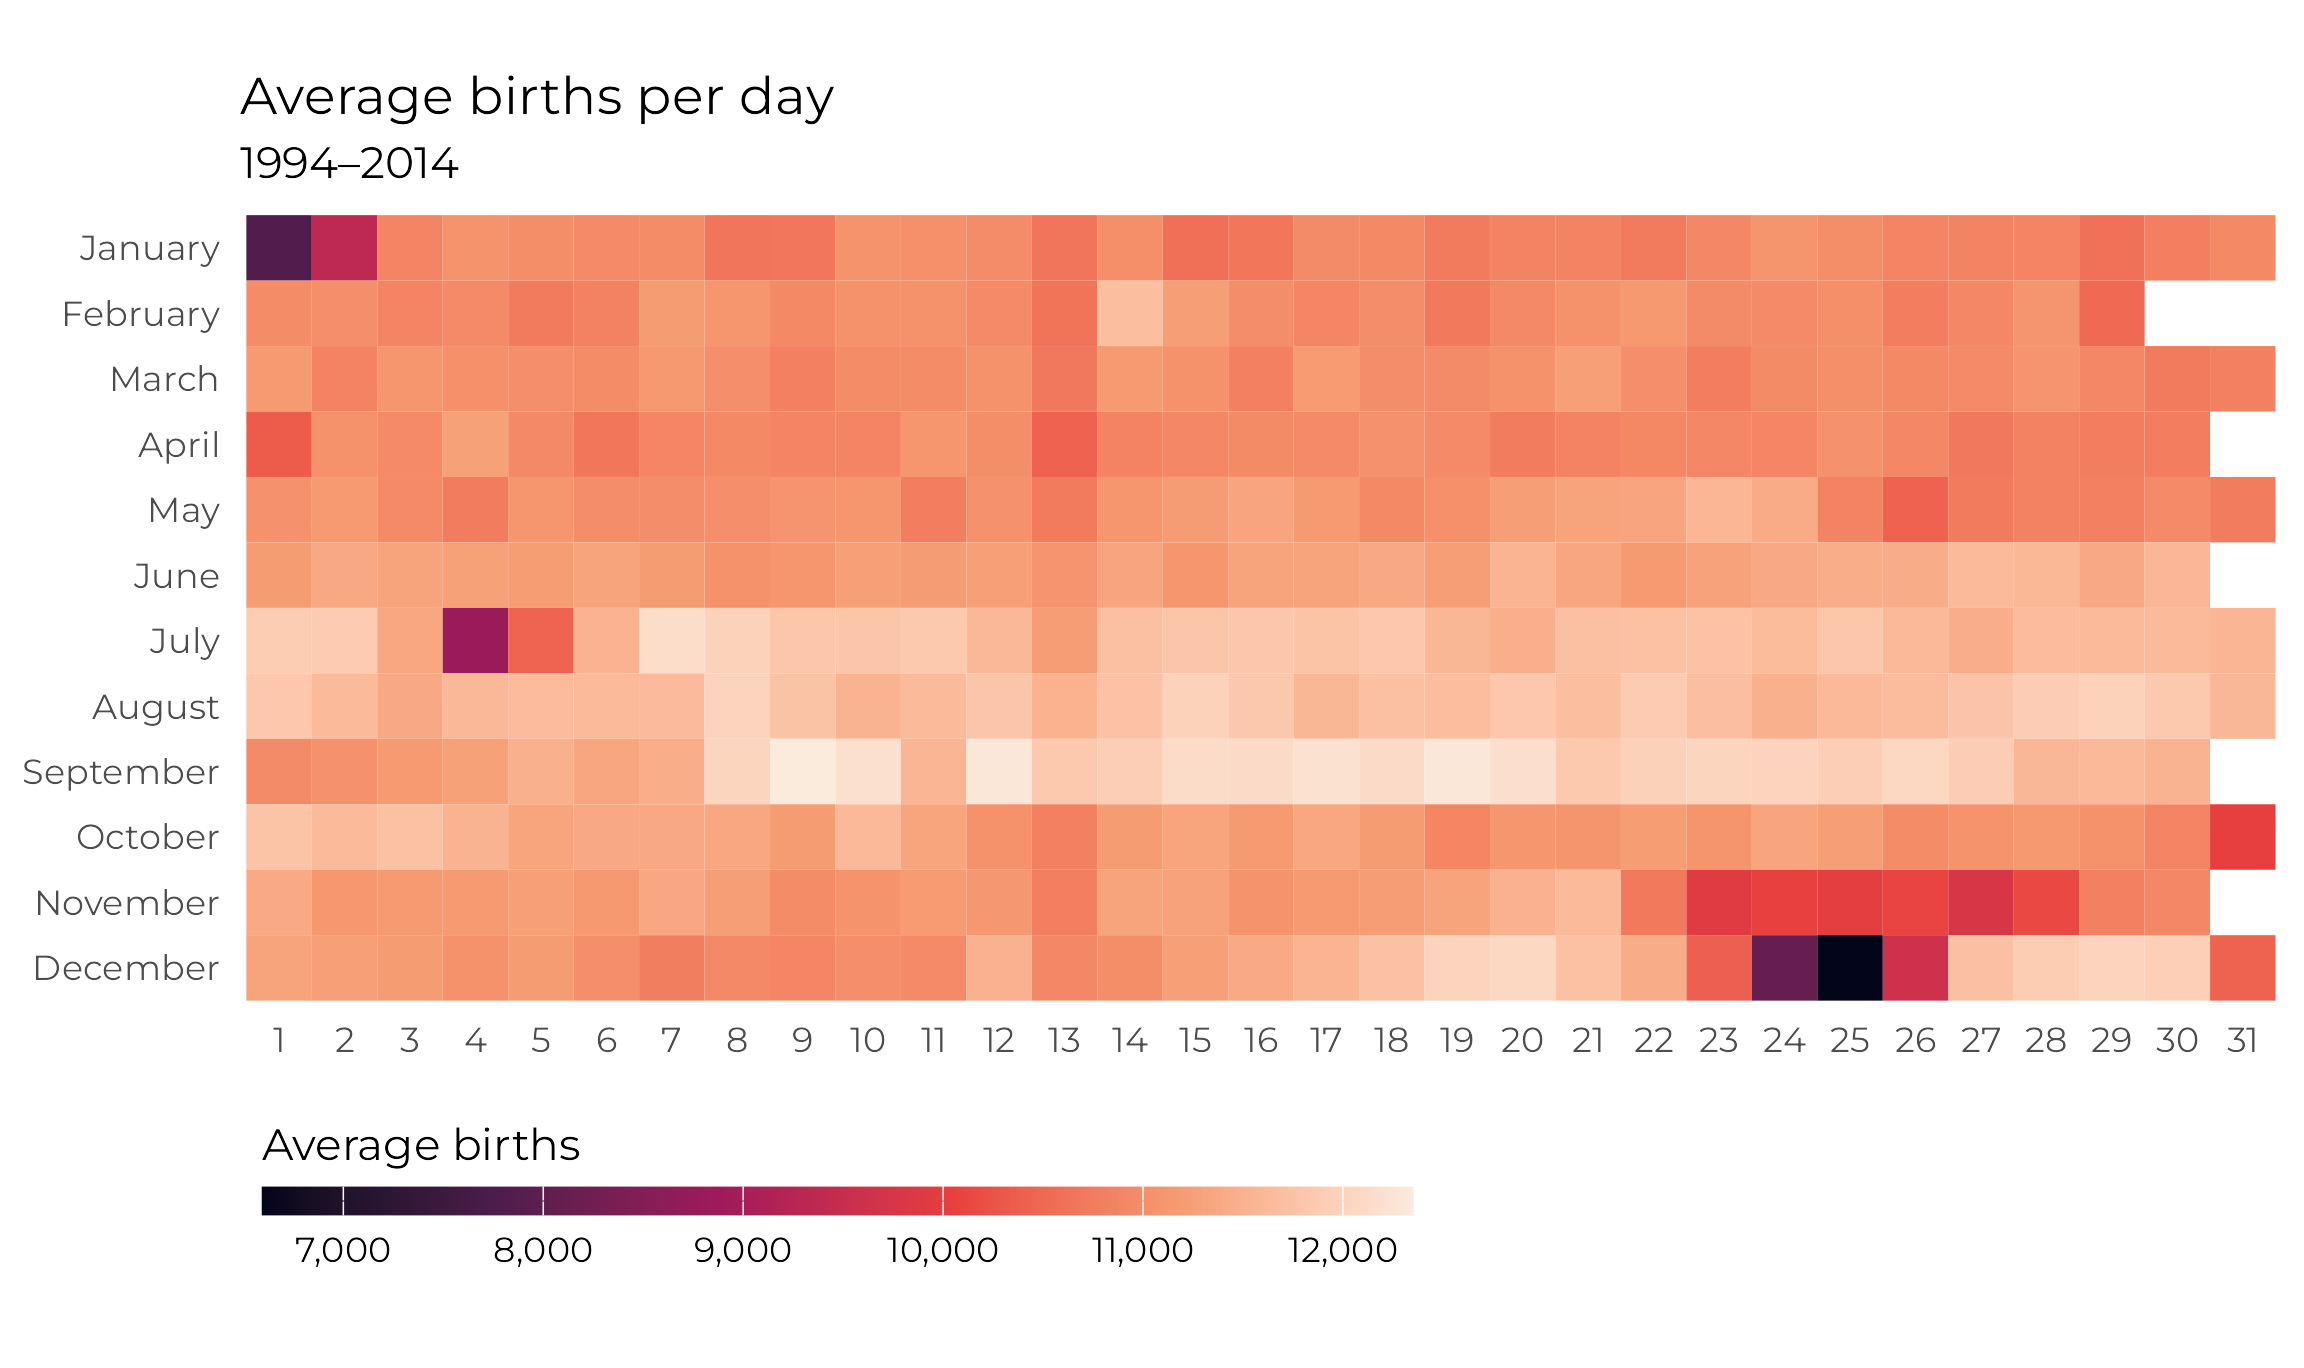
  • Heatmaps

library(moderndive)

gapminder |> 
  filter(year == 2007) |> 
  tidy_summary(continent)
# A tibble: 5 × 11
  group        n column    type     min    Q1  mean median    Q3   max    sd
  <chr>    <int> <chr>     <chr>  <dbl> <dbl> <dbl>  <dbl> <dbl> <dbl> <dbl>
1 Africa      52 continent factor    NA    NA    NA     NA    NA    NA    NA
2 Americas    25 continent factor    NA    NA    NA     NA    NA    NA    NA
3 Asia        33 continent factor    NA    NA    NA     NA    NA    NA    NA
4 Europe      30 continent factor    NA    NA    NA     NA    NA    NA    NA
5 Oceania      2 continent factor    NA    NA    NA     NA    NA    NA    NA

gapminder |> 
  filter(year == 2007) |> 
  count(continent)
# A tibble: 5 × 2
  continent     n
  <fct>     <int>
1 Africa       52
2 Americas     25
3 Asia         33
4 Europe       30
5 Oceania       2
gapminder |> 
  filter(year == 2007) |> 
  count(continent) |> 
  mutate(prop = n / sum(n))
# A tibble: 5 × 3
  continent     n   prop
  <fct>     <int>  <dbl>
1 Africa       52 0.366 
2 Americas     25 0.176 
3 Asia         33 0.232 
4 Europe       30 0.211 
5 Oceania       2 0.0141

penguins |>  
  count(species, island)
    species    island   n
1    Adelie    Biscoe  44
2    Adelie     Dream  56
3    Adelie Torgersen  52
4 Chinstrap     Dream  68
5    Gentoo    Biscoe 124
penguins |>  
  count(species, island) |> 
  mutate(prop = n / sum(n))
    species    island   n      prop
1    Adelie    Biscoe  44 0.1279070
2    Adelie     Dream  56 0.1627907
3    Adelie Torgersen  52 0.1511628
4 Chinstrap     Dream  68 0.1976744
5    Gentoo    Biscoe 124 0.3604651

penguins |>  
  count(species, island) |> 
  group_by(species) |> 
  mutate(prop = n / sum(n))
# A tibble: 5 × 4
# Groups:   species [3]
  species   island        n  prop
  <fct>     <fct>     <int> <dbl>
1 Adelie    Biscoe       44 0.289
2 Adelie    Dream        56 0.368
3 Adelie    Torgersen    52 0.342
4 Chinstrap Dream        68 1    
5 Gentoo    Biscoe      124 1    
penguins |>  
  count(species, island) |> 
  group_by(island) |> 
  mutate(prop = n / sum(n))
# A tibble: 5 × 4
# Groups:   island [3]
  species   island        n  prop
  <fct>     <fct>     <int> <dbl>
1 Adelie    Biscoe       44 0.262
2 Adelie    Dream        56 0.452
3 Adelie    Torgersen    52 1    
4 Chinstrap Dream        68 0.548
5 Gentoo    Biscoe      124 0.738

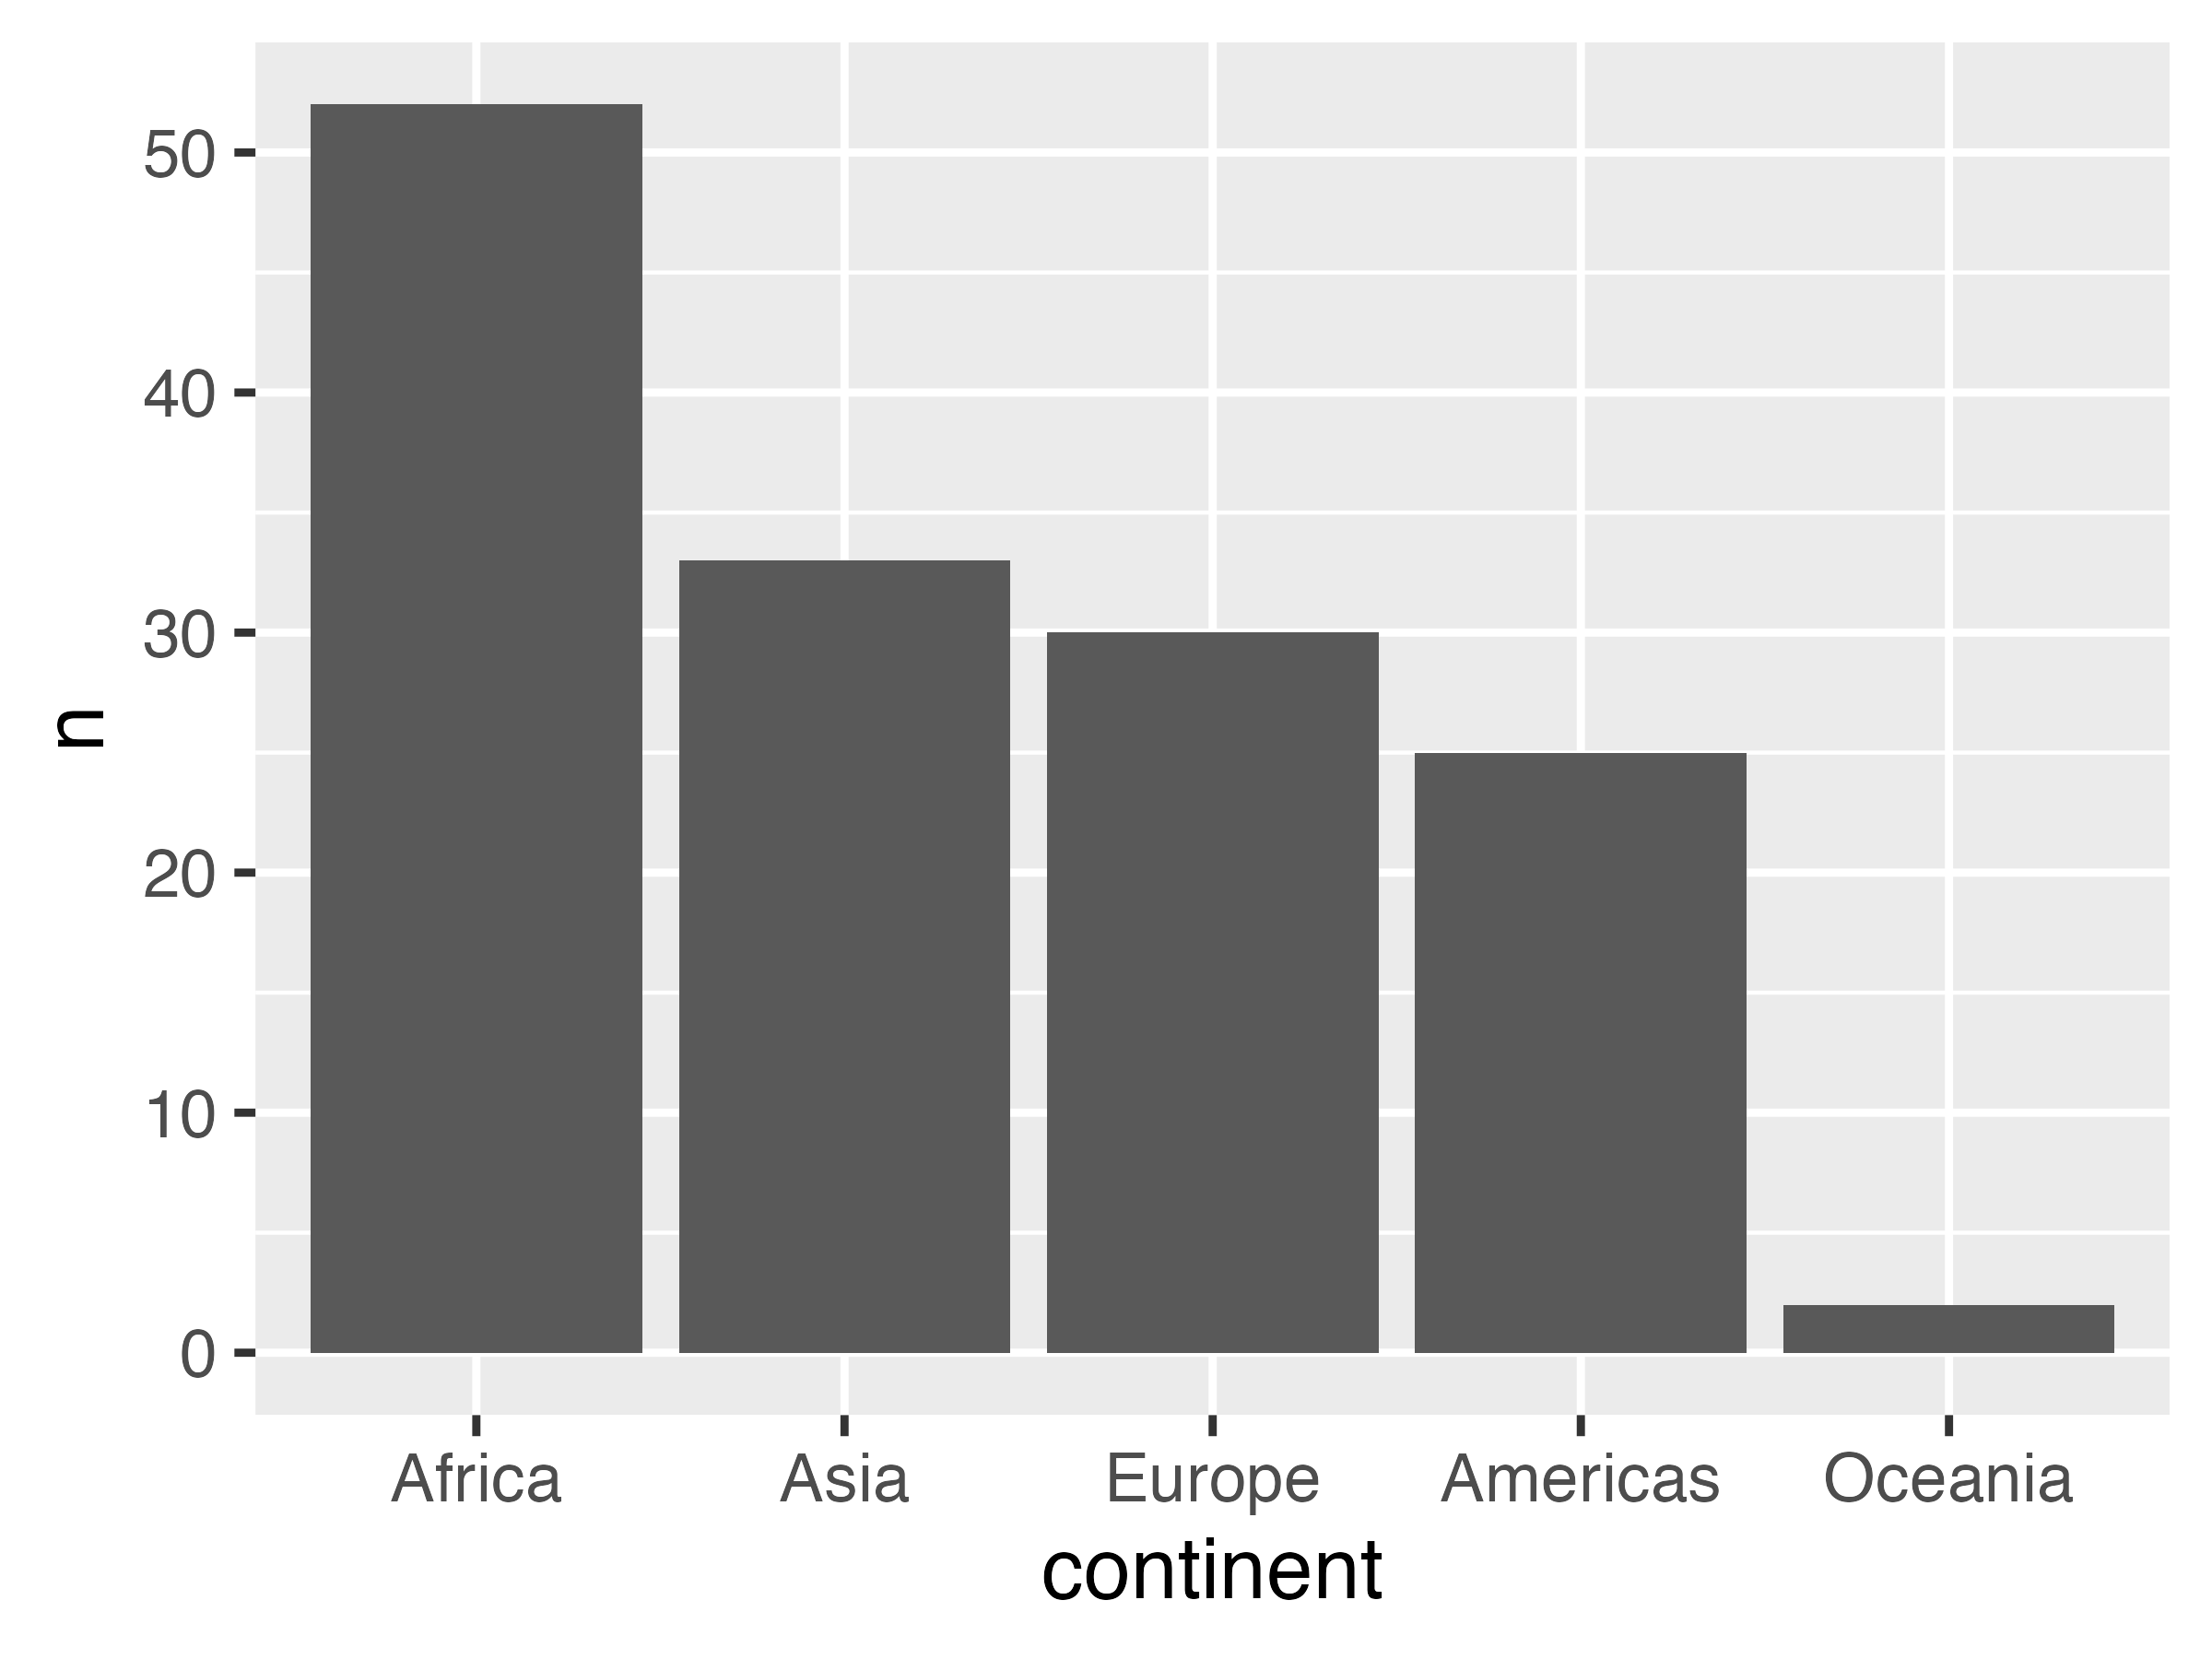
Bar plot

gapminder |>
  filter(year == 2007) |>
  count(continent) |>
  mutate(
    continent = fct_reorder(
      continent,
      desc(n)
    )
  ) |>
  ggplot(
    aes(x = continent, y = n)
  ) +
  geom_col()
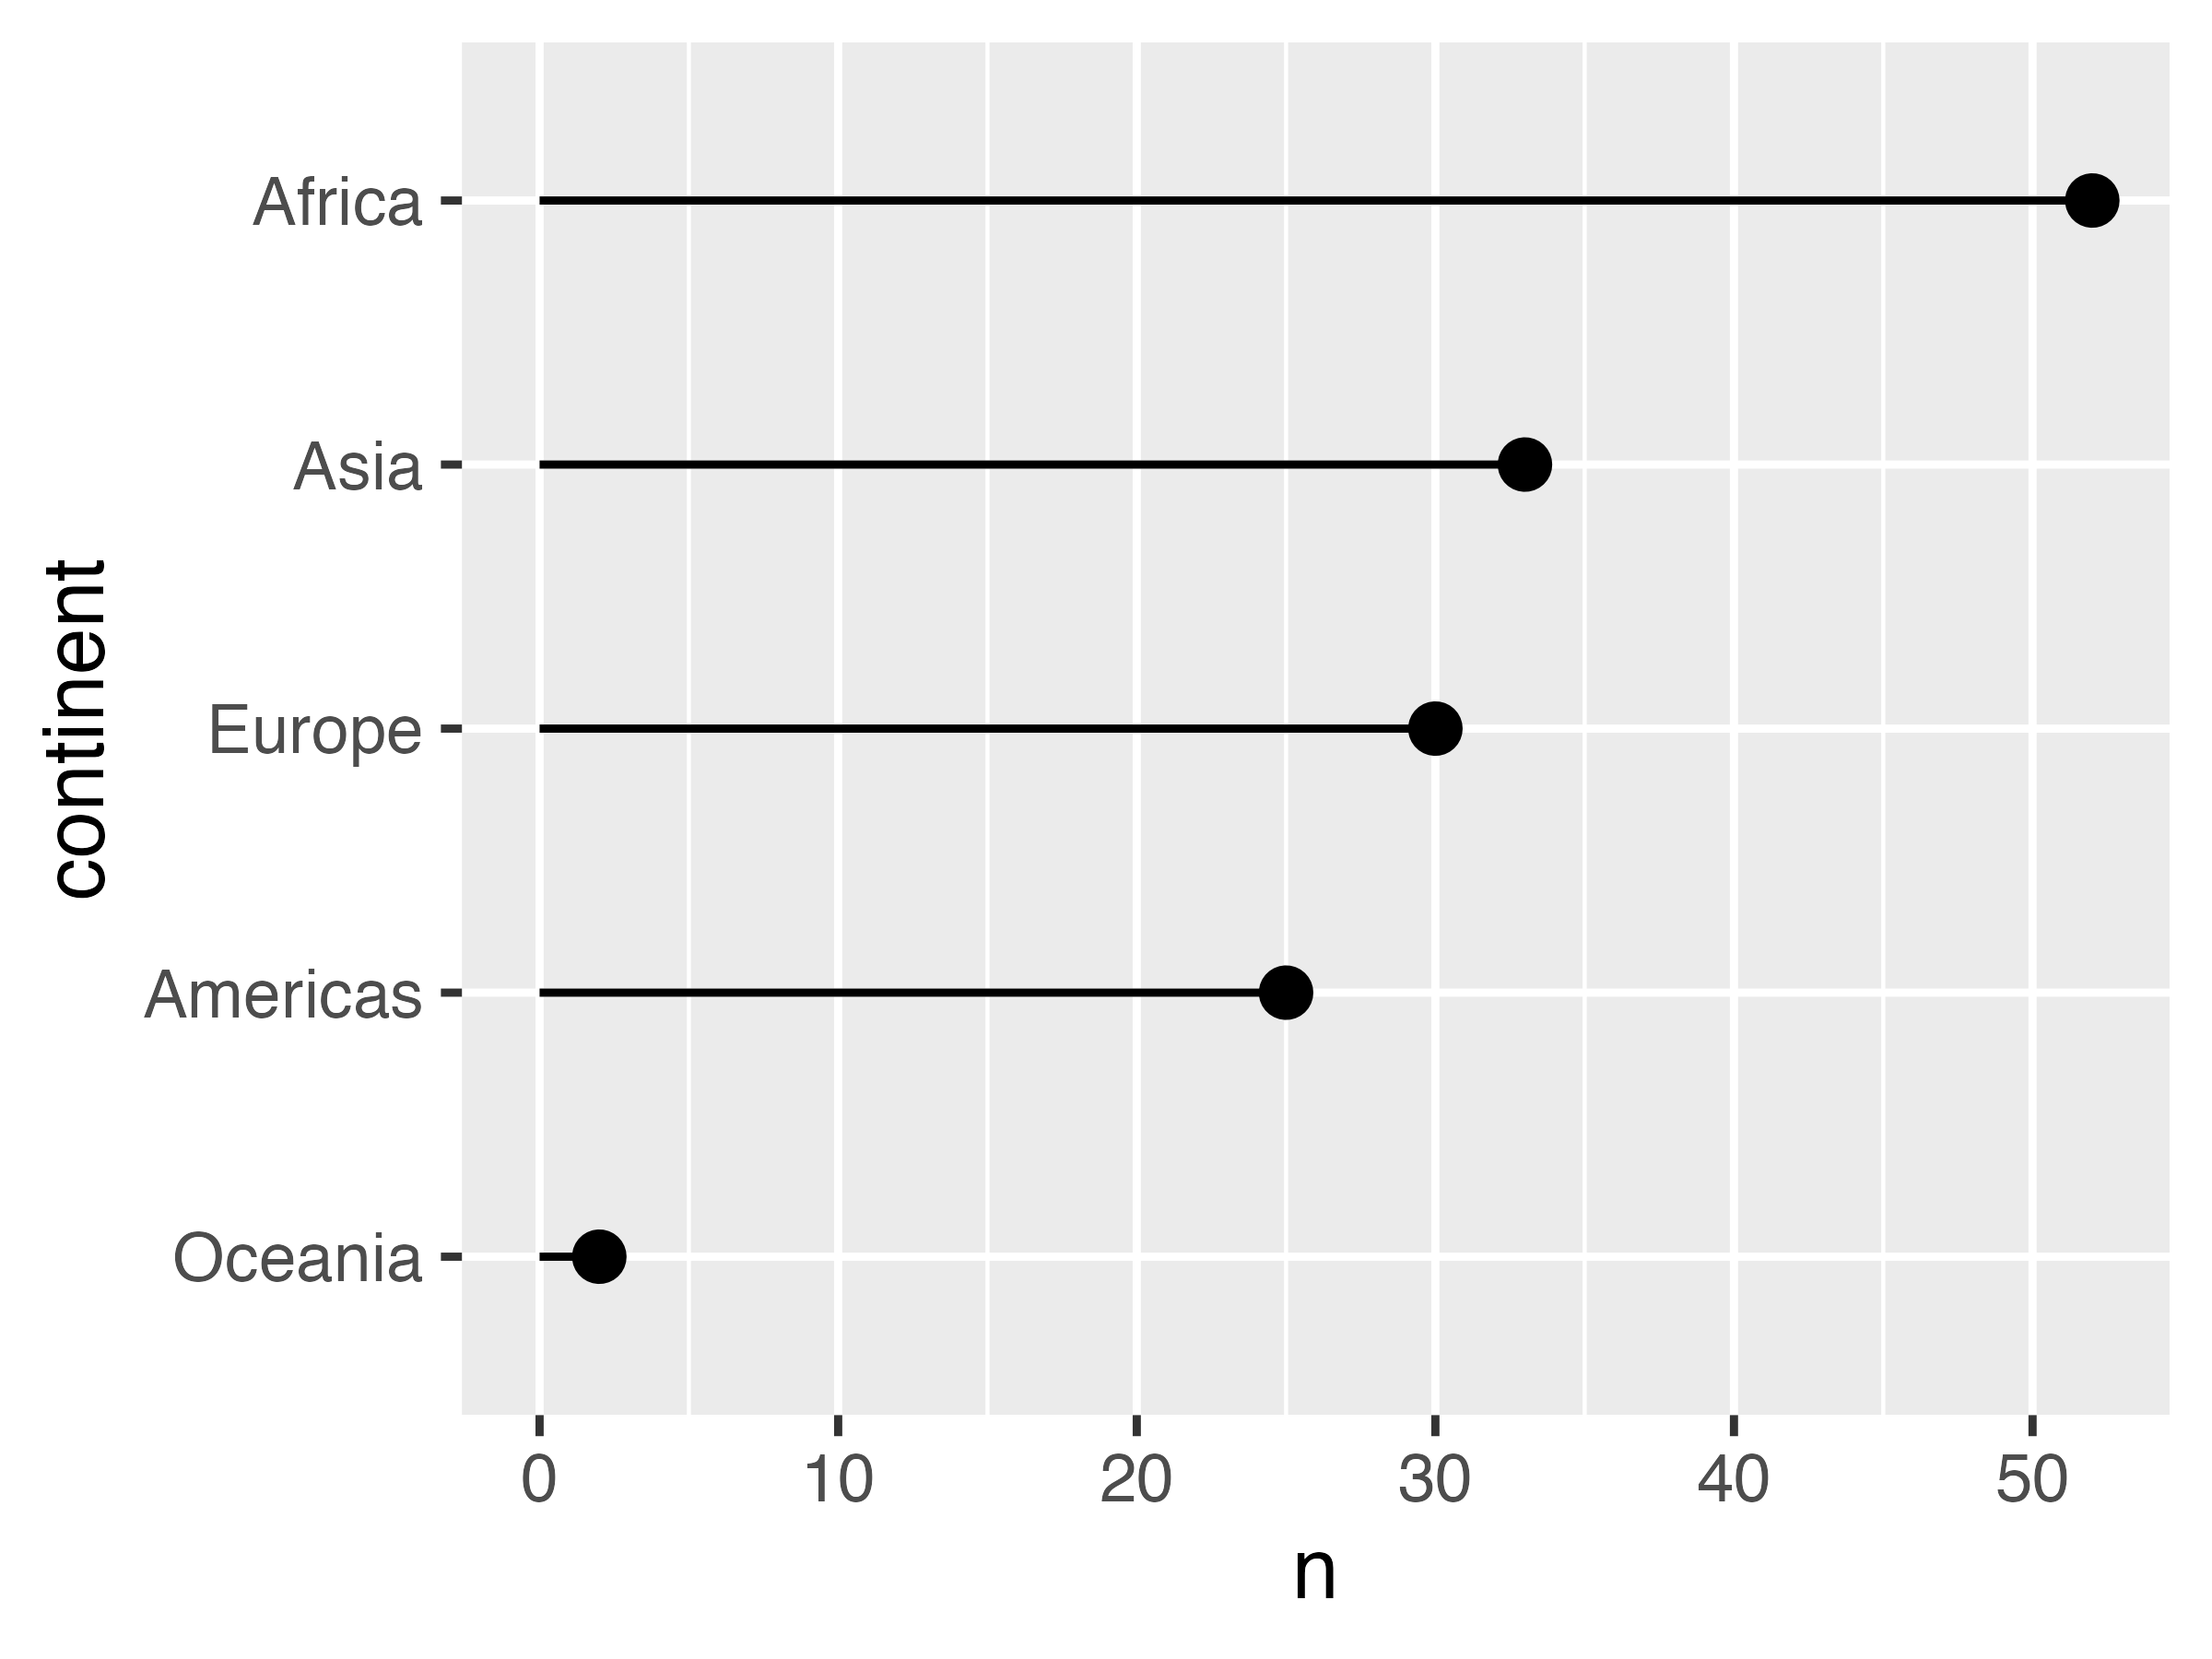
Lollipop plot

gapminder |>
  filter(year == 2007) |>
  count(continent) |>
  mutate(
    continent = fct_reorder(
      continent,
      n
    )
  ) |>
  ggplot(
    aes(x = n, y = continent)
  ) +
  geom_pointrange(
    aes(xmin = 0, xmax = n)
  )
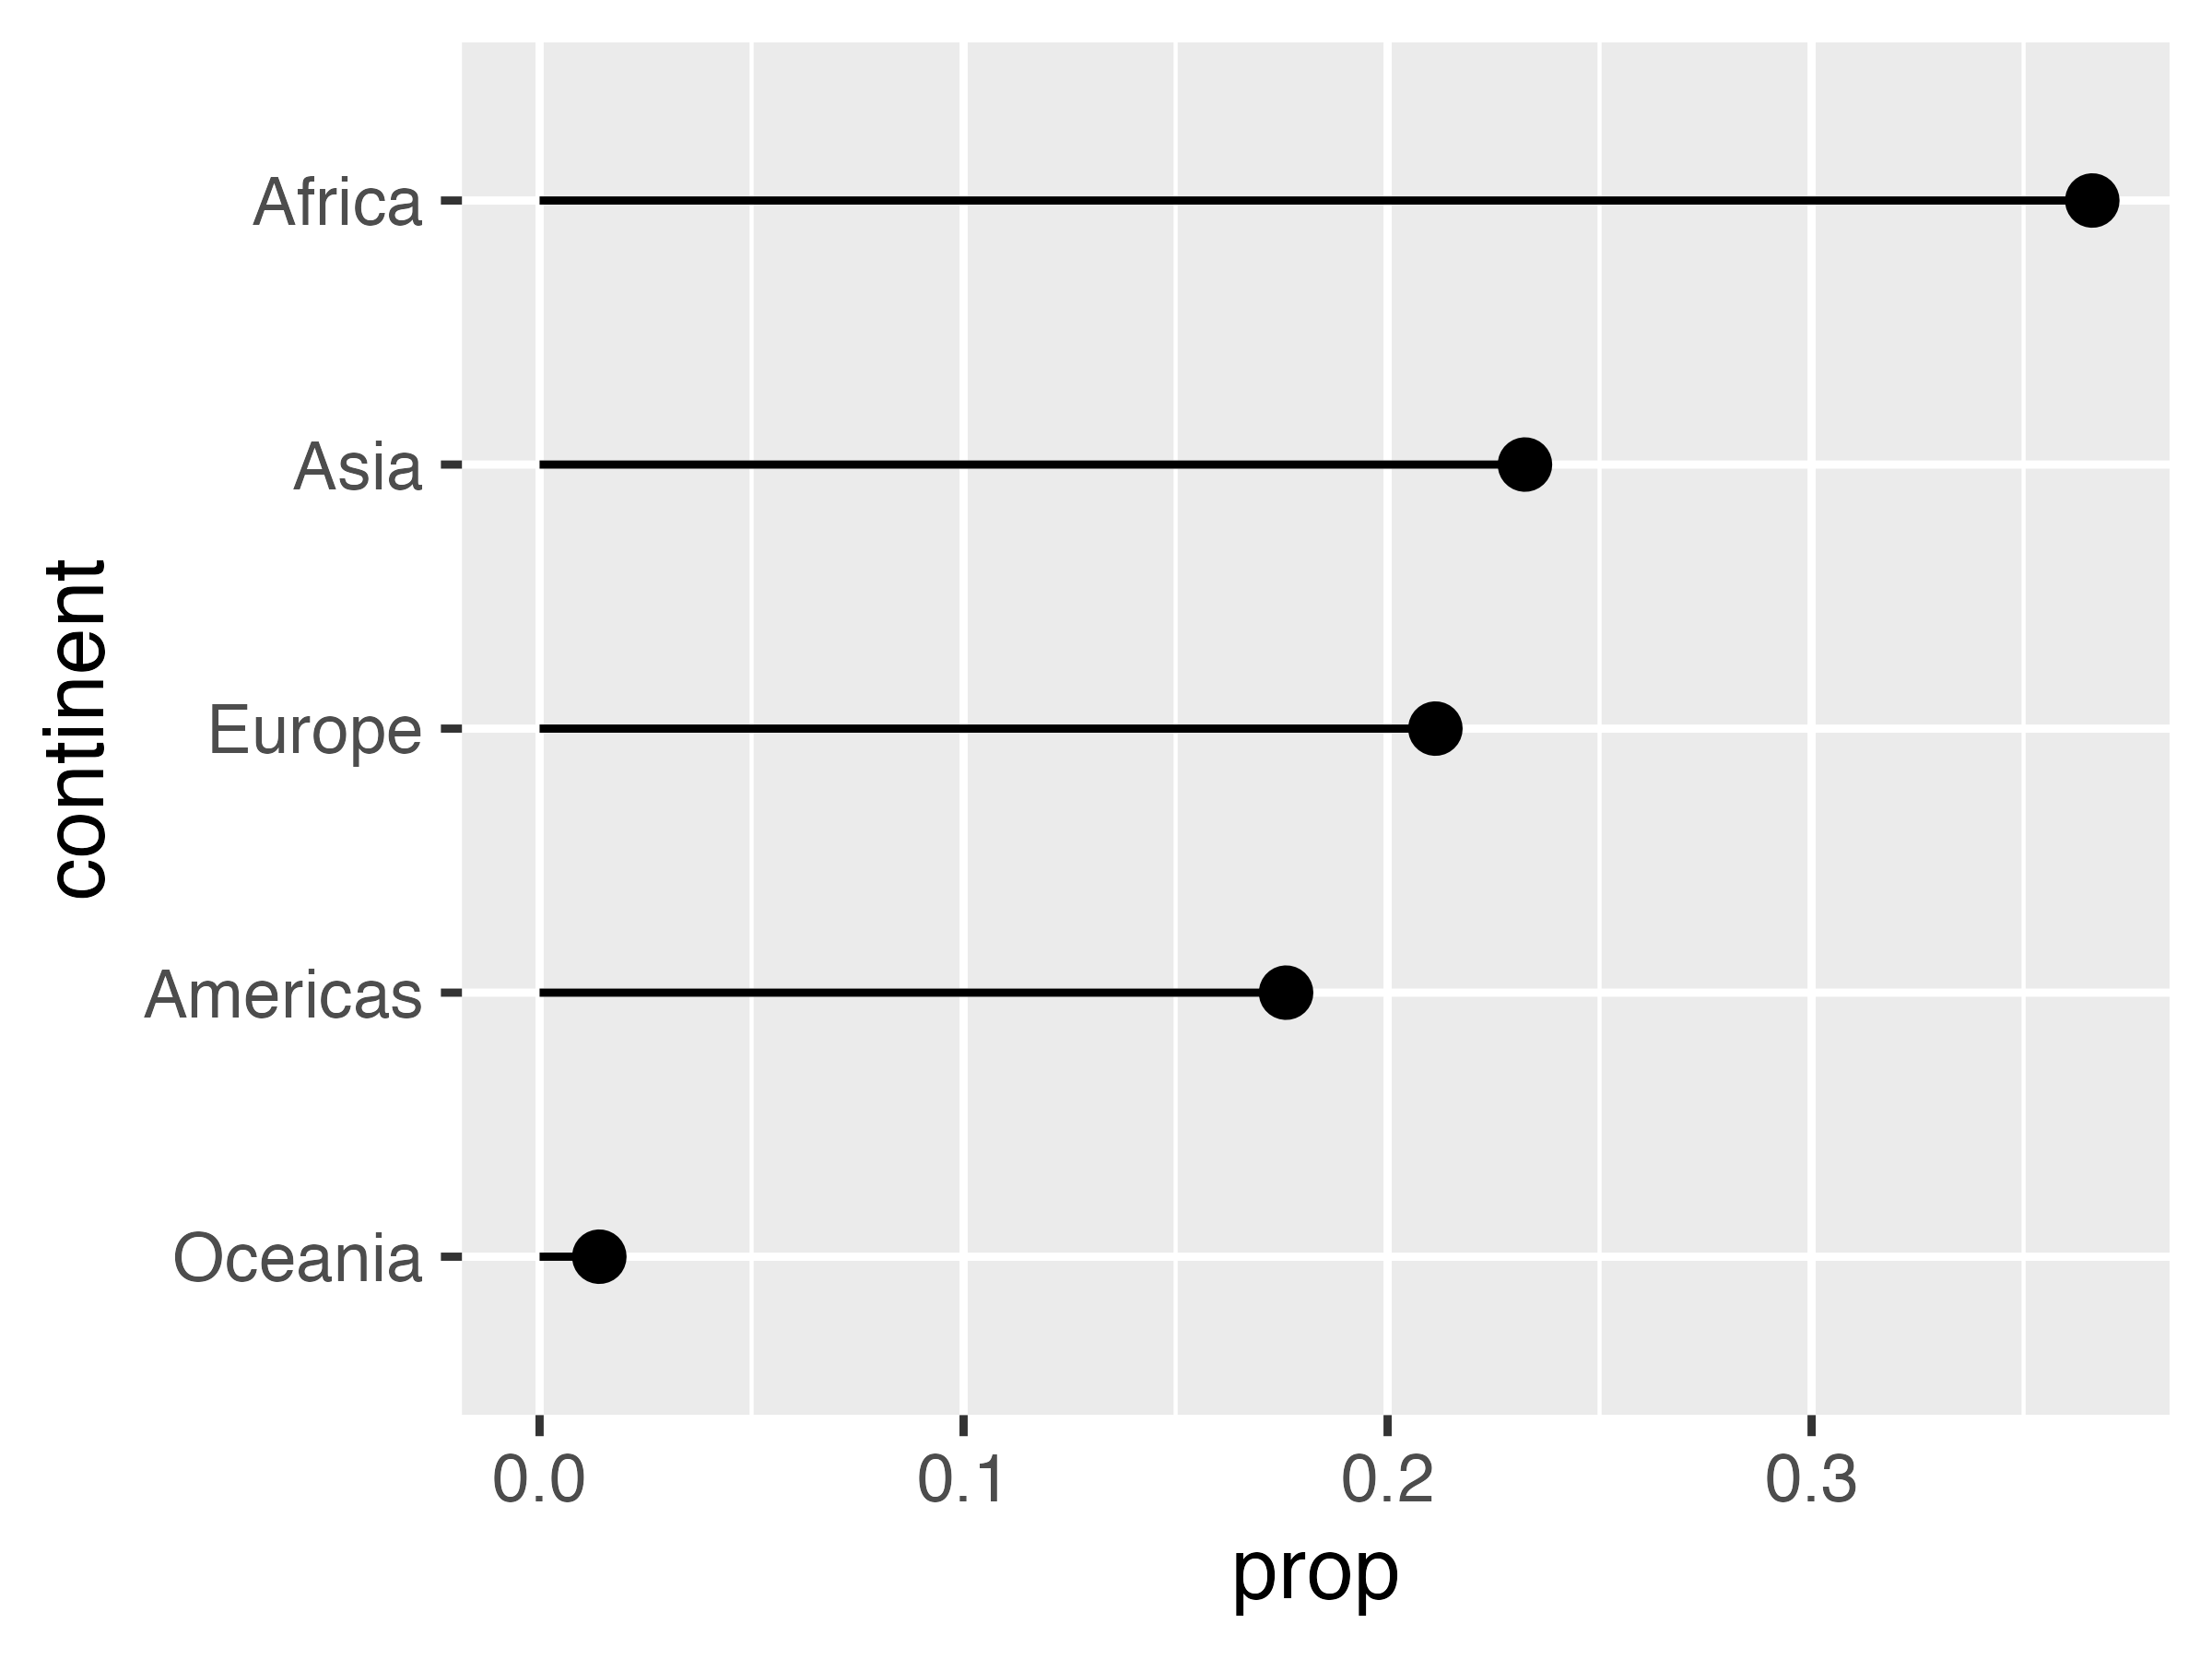
Lollipop plot

gapminder |>
  filter(year == 2007) |>
  count(continent) |>
  mutate(
    continent = fct_reorder(
      continent,
      n
    ),
    prop = n / sum(n)
  ) |>
  ggplot(
    aes(x = prop, y = continent)
  ) +
  geom_pointrange(
    aes(xmin = 0, xmax = prop)
  )
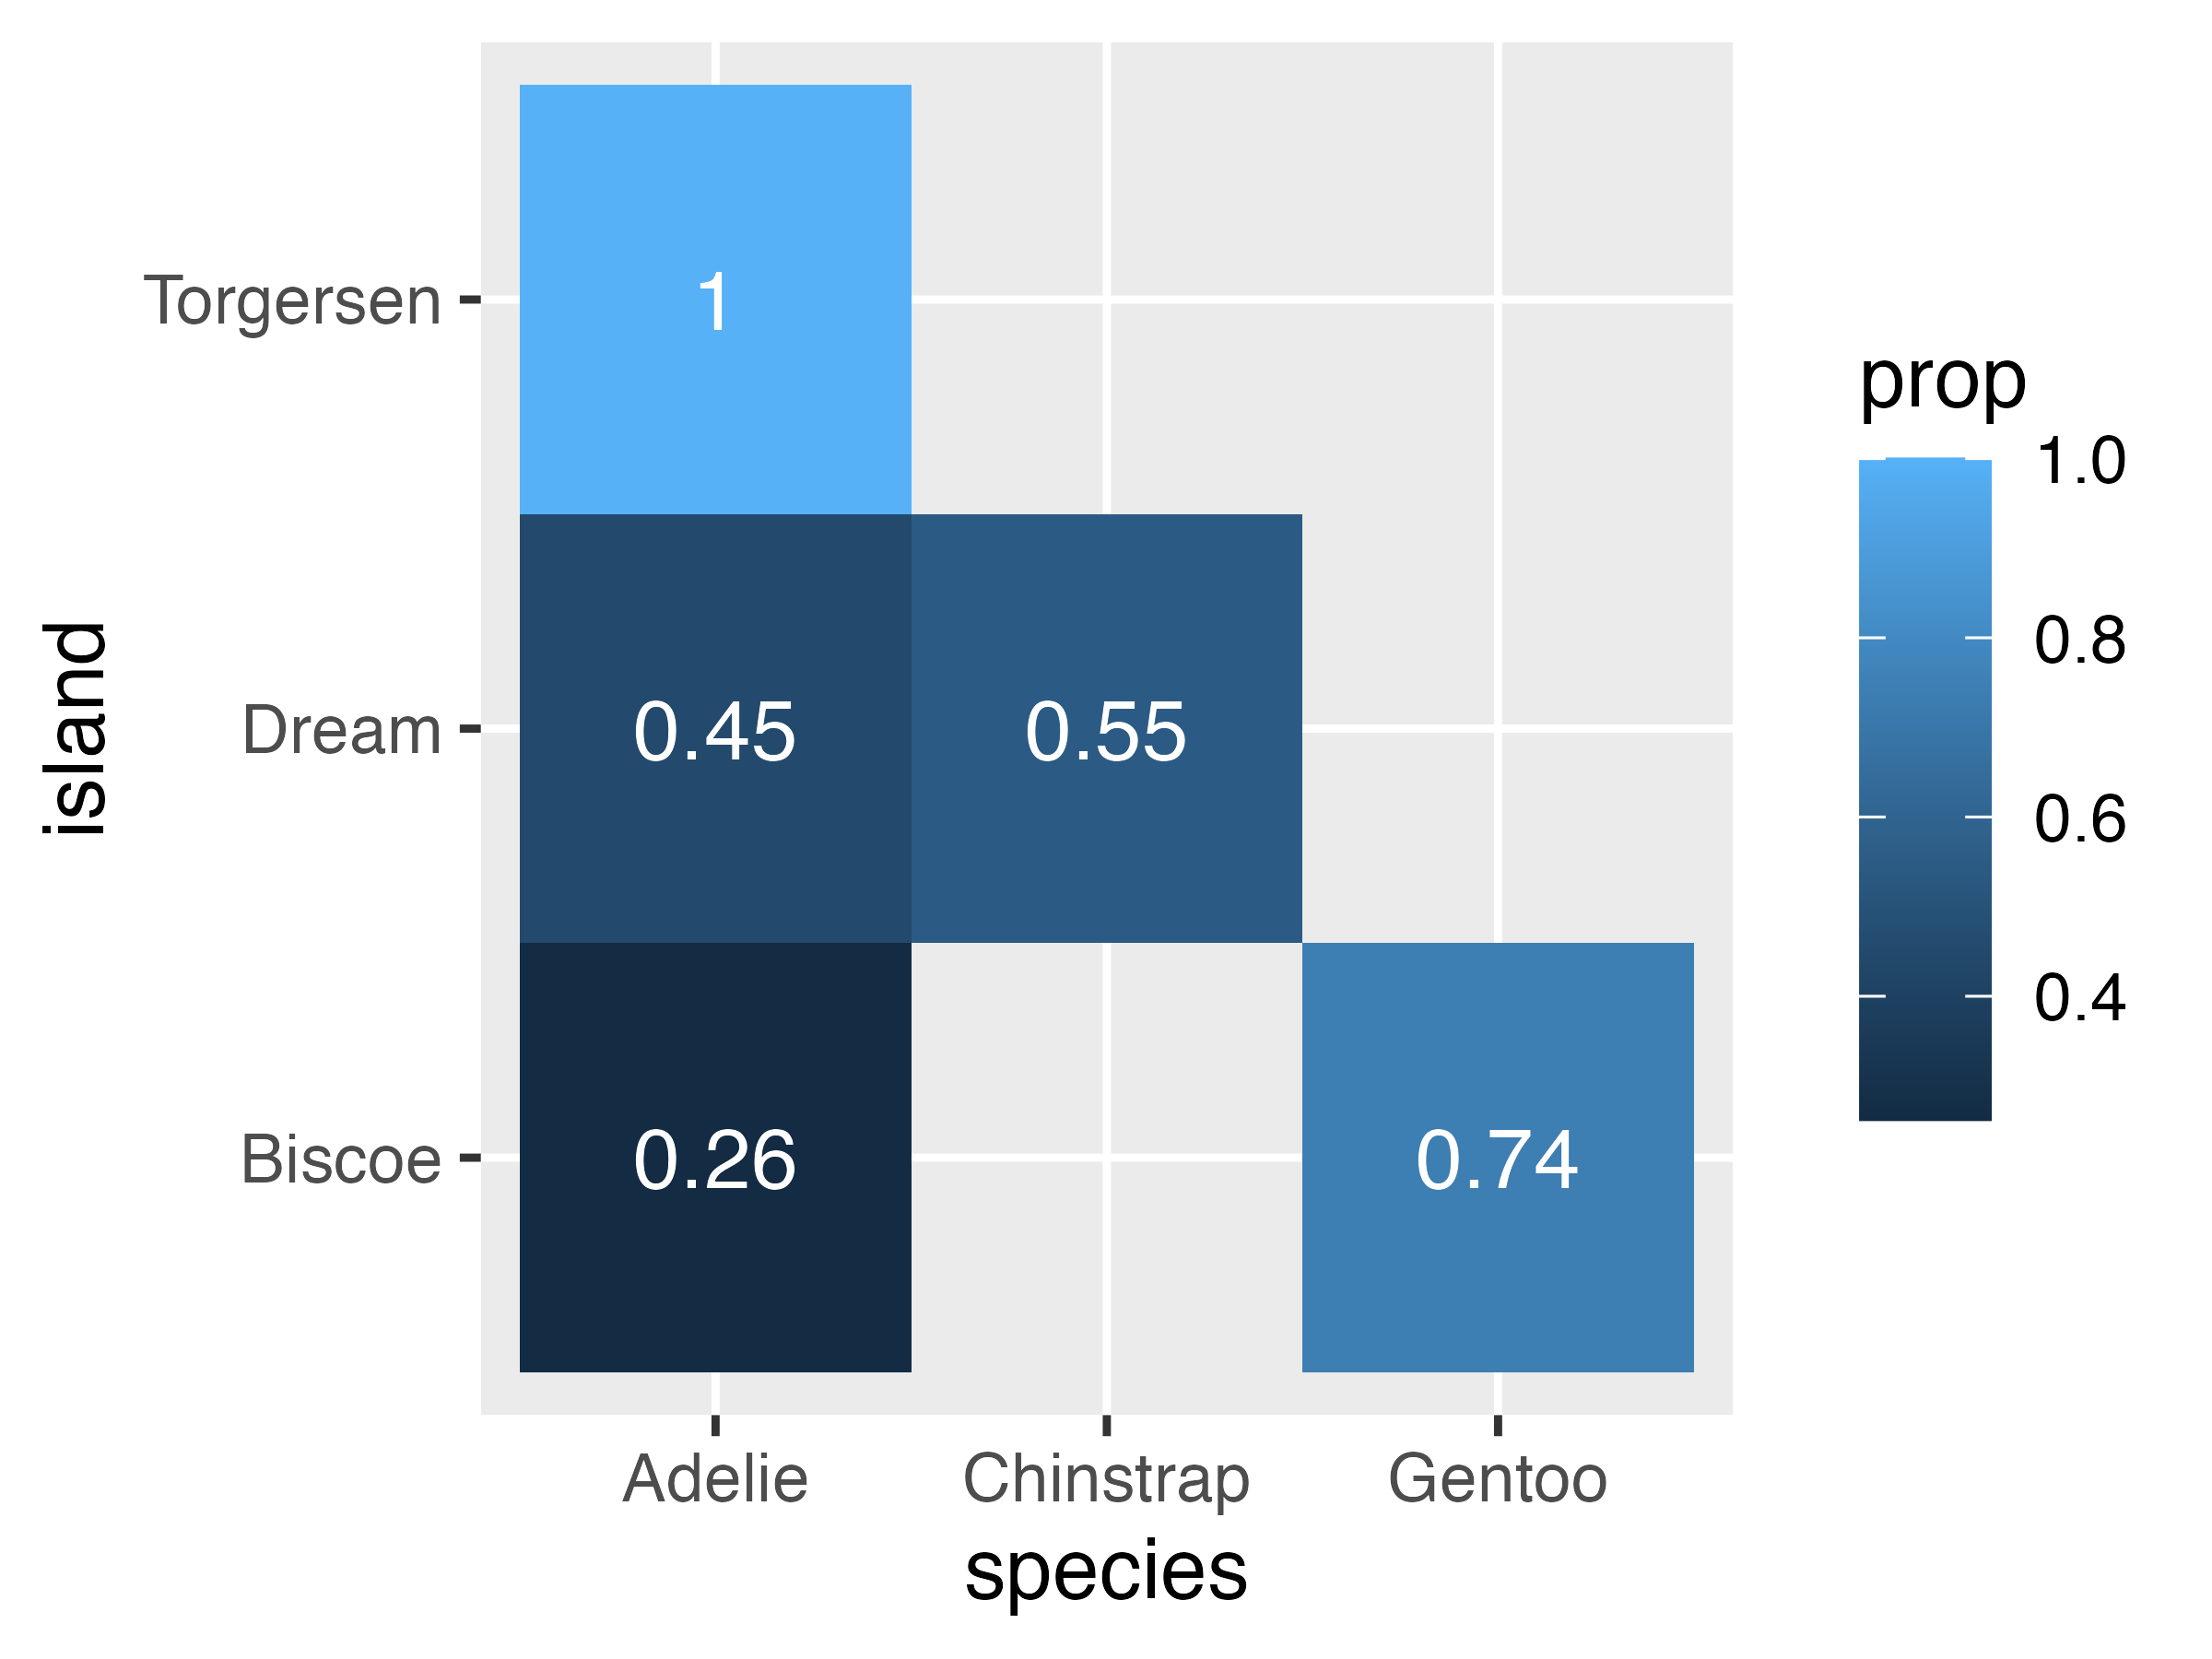
Heat map

penguins |>
  count(species, island) |>
  group_by(island) |>
  mutate(prop = n / sum(n)) |>
  ggplot(
    aes(
      x = species,
      y = island,
      fill = prop
    )
  ) +
  geom_tile() +
  geom_text(
    aes(label = round(prop, 2)),
    color = "white"
  )
Summary

Describing variables

Variable = column; observation = row

Variables

Identification vs. measurement

Numbers: continuous, count

Categories: categorical, binary, ordinal

Qualitative

Descriptions

Numeric variables

  • Summary statistics: mean, median, standard deviation, min, max, percentiles
  • Plots: histograms, density plots, dot plots, raincloud plots

Categorical variables

  • Summary statistics: counts, proportions
  • Plots: Bar plots, lollipop plots, heatmaps

Our turn!

Exploring cars in Qatar

https://profmusgrave.github.io/qatarcars/

  • Identifying variable types
    • Identification vs. measurement
    • Numeric vs. categorical (and subtypes)
  • Describe variables
    • Numbers
    • Plots