
Intro to sampling

Quantitative Methods for
International Politics

IPOL 3270 • Fall 2026

October 20, 2026

Plan for today

Populations and samples

Sampling variation

Populations
and samples

Data so far

  • World happiness, Gapminder, V-Dem, UN data
  • (Nearly) every country
  • Regression coefficients describe entire countries
  • We can (theoretically) measure every country

But often we can’t measure everything we care about

The Arab Barometer

  • Huge public opinion survey in the Middle East and North Africa
  • Wave 8 (2023–2024): 15,627 people in 8 countries
  • Face-to-face interviews in random households

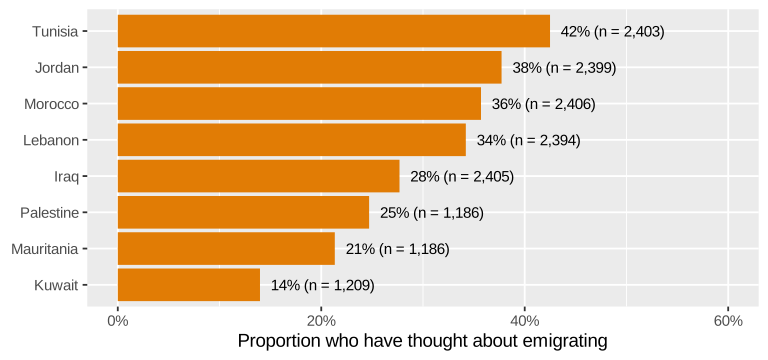
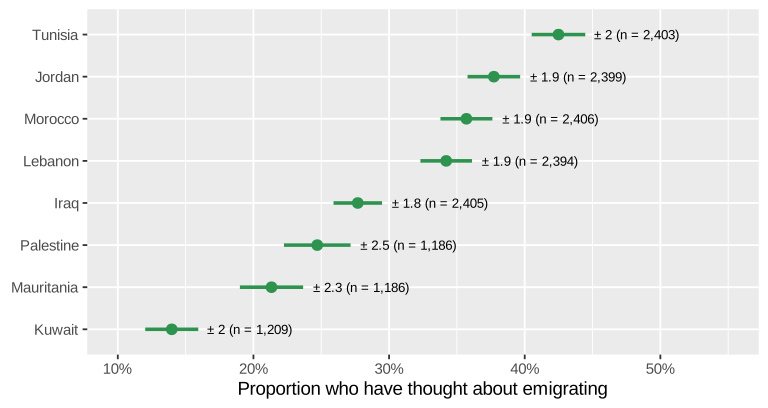
Some people decide to leave their countries to live somewhere else. Have you ever thought about emigrating from [your country]?

Thought about emigrating?

42% of all Tunisians? From only 2,403 people?

Population vocabulary

Population

A collection of things in the world

People, countries, voters, MPs, exports, aid projects, legislation

All adults in Tunisia

Population parameter

Something we want to know about the population

  • Average life expectancy in GCC countries
  • Median commute time in Doha
  • Relationship between poverty and fertility rates

Proportion of all Tunisian adults who have thought about emigrating (\(p\))

Parameters are what you measure to answer research questions

Also called “estimands”—the thing you care about

Counting the population

Census

Measure every single thing in the population

Expensive, slow, often impossible

Sampling

Only measure a part of the population

Interview 2,403 Tunisians

Measuring the sample

Sample statistic
(or point estimate)

The population parameter (or estimand), but calculated from a sample of the population

Uses a hat! \(\widehat{p}\) = 0.425

Same hat as \(\widehat{y}\) in regression: hat = estimate

Parameters and statistics

Population parameter Sample statistic
Proportion \(p\) \(\widehat{p}\)
Mean \(\mu\) \(\bar{x}\)
Regression slope \(\beta_1\) \(b_1\) or \(\widehat{\beta}_1\)

Every regression coefficient you calculate from a sample is an estimate of some unknown population value

Is the sample any good?

  • Representative: Does the sample look like the population?
  • Unbiased: Did every part of the population have the same chance of being picked?
  • Generalizable: Is \(\widehat{p}\) a good guess for \(p\)?

Random sampling fixes all these

What if we want to save money
and we just run an online survey?

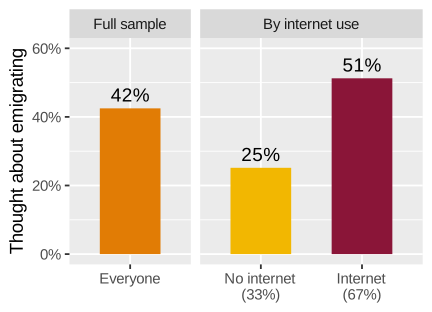
  • 33% of Tunisians don’t use the internet
  • They’re much less likely to have thought about emigrating
  • An online survey only sees internet users: 51% instead of 42%

Even if we surveyed a million Tunisians online,
our parameter would be wrong!

Sampling variation

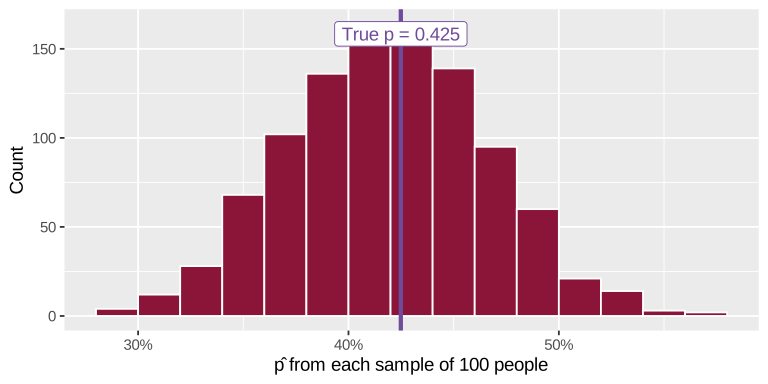
Pretend the 2,403 Tunisian respondents are the entire population

We know the true parameter: \(p\) = 0.425

What happens if we take random samples of 100 people from this population?

Sample Yes \(\widehat{p}\)
1 40 0.4
2 40 0.4
3 43 0.43
4 44 0.44
5 39 0.39
  • Every sample gives a different \(\widehat{p}\)
  • None of them are exactly 0.425
  • That’s fine! It’s just sampling variation

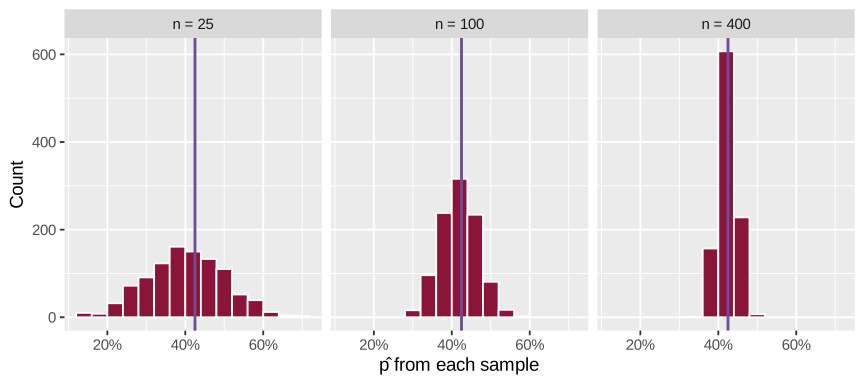
Repeat 1,000 times

The sampling distribution

Sample size is important!

Bigger samples → less sampling variation →
more precise estimates

Standard error

The standard deviation of the sampling distribution

“How much does \(\widehat{p}\) typically bounce around from sample to sample?”

Sample size Standard error
25 10.0 points
100 4.7 points
400 2.2 points

4× the sample size = ½ the standard error

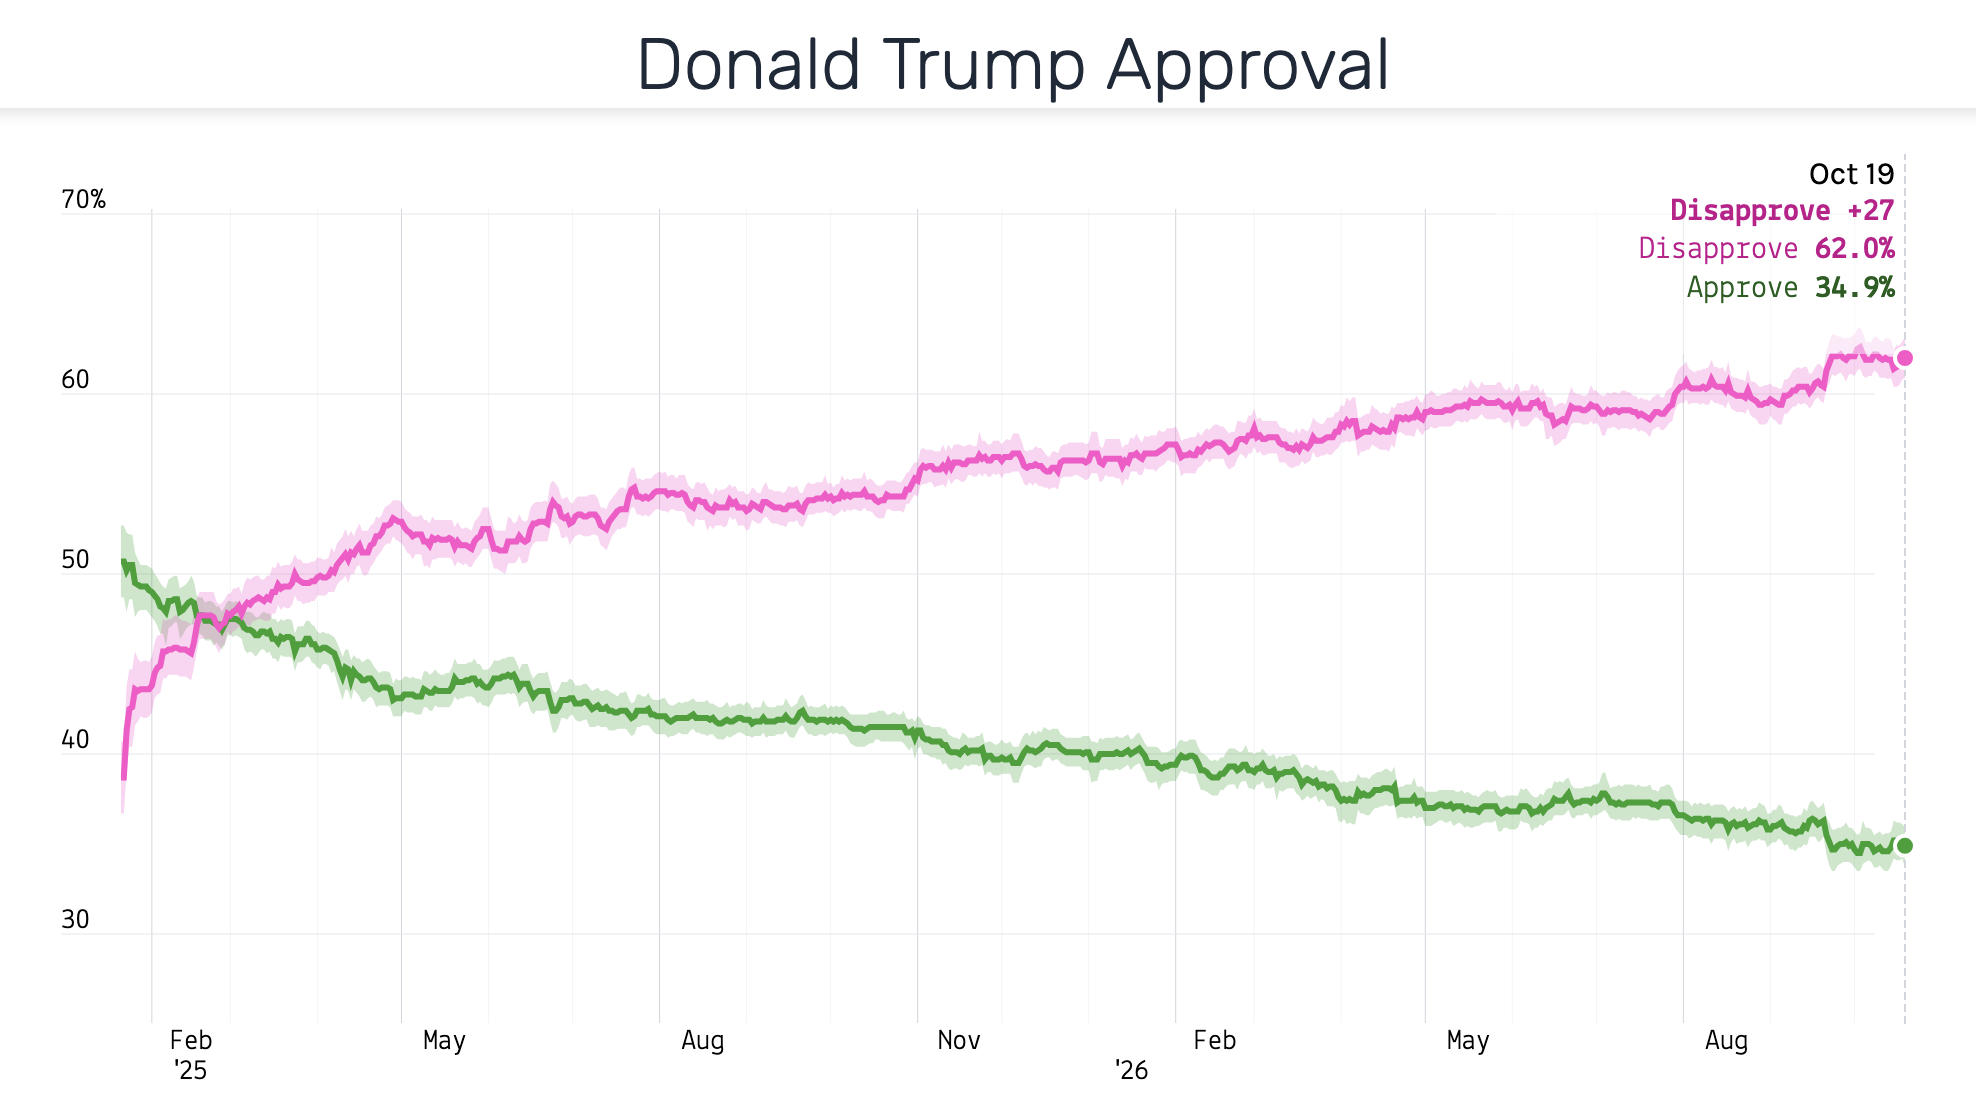
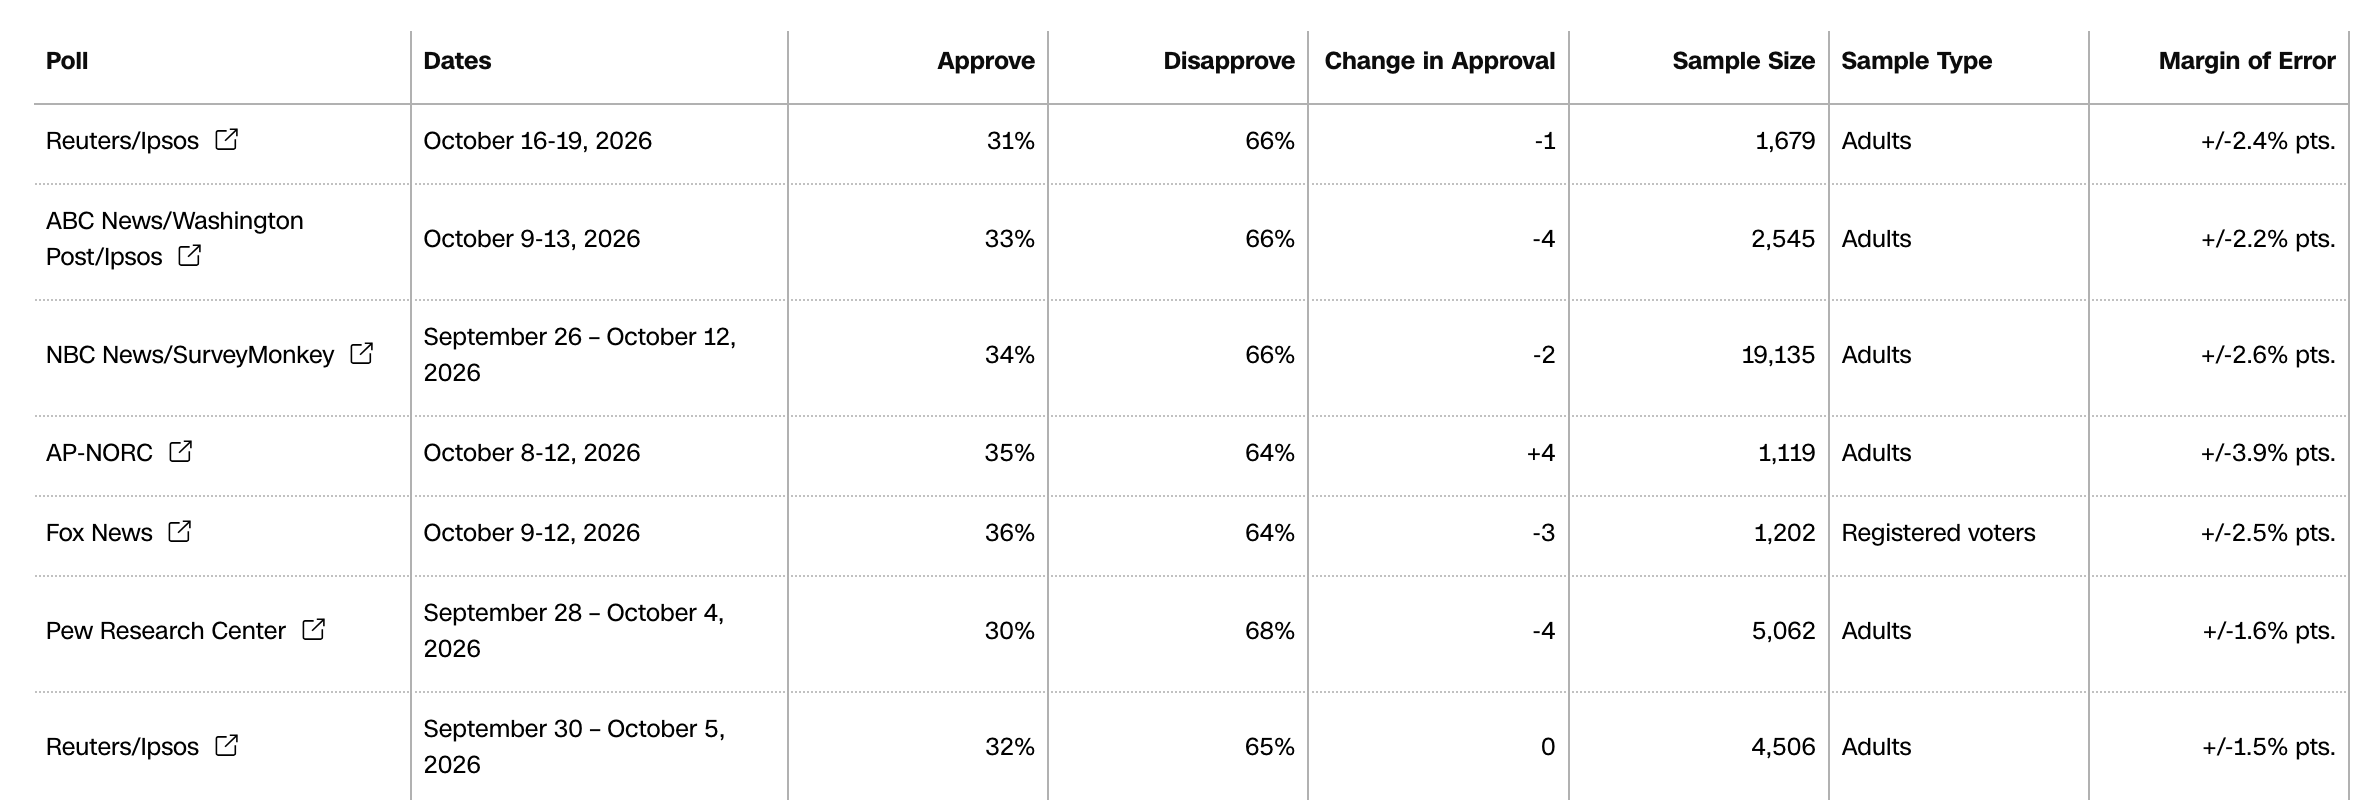
Trump’s approval rating is 34.9% (+/-2.1% pts.)

How accurate is the estimate?

  • In life we only get one sample
  • We can’t see the whole sampling distribution—we don’t know what the true population parameter is
  • The margin of error tells us how far off our one \(\widehat{p}\) could plausibly be

Margin of error

Margin of error ≈ 2 × standard error

If we took lots of samples, about 95% of them would land within one margin of error of the truth

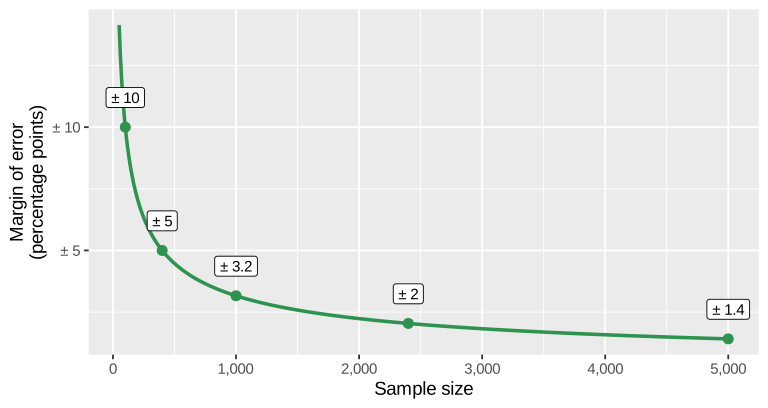
Quick rule of thumb for proportions: \(\text{MOE} \approx \frac{1}{\sqrt{n}}\)

\(n\) = 1,000 → \(\frac{1}{\sqrt{1000}}\) = ± 3.2 points

(More on this next week, with confidence intervals!)

Diminishing returns

Most national surveys stop at ≈1,000–2,500 people

Emigration, with margins of error

Main ideas

  • We use a sample to estimate things about a population
  • A sample statistic (\(\widehat{p}\)) estimates a population parameter (\(p\)) or estimand
  • Random sampling keeps estimates unbiased; a bigger biased sample is still biased
  • Every sample is a little different: sampling variation
  • Bigger samples → smaller standard errors and margins of error