Sampling I & II
Quantitative Methods for
International Politics
IPOL 3270 • Fall 2026
October 25, 2026

Plan for today
Populations and samples
M&Ms
Sampling variation
Uncertainty
Choosing a sample size
Populations
and samples
Data so far
- World happiness, Gapminder, V-Dem, UN data
- (Nearly) every country
- Regression coefficients describe entire countries
- We can (theoretically) measure every country
But often we can’t measure everything we care about
The Arab Barometer
- Huge public opinion survey in the Middle East and North Africa
- Wave 8 (2023–2024): 15,627 people in 8 countries
- Face-to-face interviews in random households
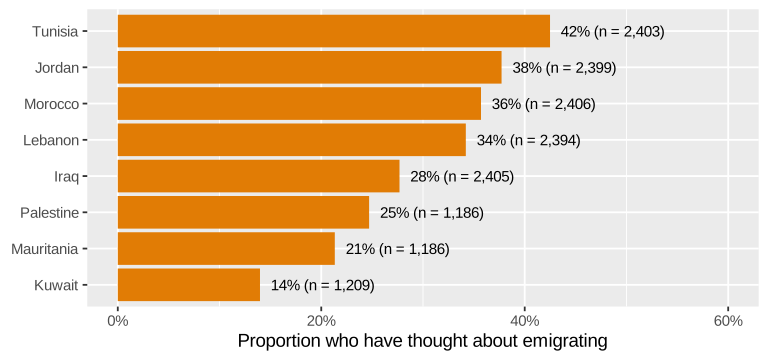
Some people decide to leave their countries to live somewhere else. Have you ever thought about emigrating from [your country]?
Thought about emigrating?
42% of all Tunisians? From only 2,403 people?
Population vocabulary
Population
A collection of things in the world
People, countries, voters, MPs, exports, aid projects, legislation
All adults in Tunisia
Population parameter
Something we want to know about the population
- Average life expectancy in GCC countries
- Median commute time in Doha
- Relationship between poverty and fertility rates
Proportion of all Tunisian adults who have thought about emigrating (p)
Parameters are what you measure to answer research questions
Also called “estimands”—the thing you care about
Counting the population
Census
Measure every single thing
in the population
Expensive, slow, often impossible
Sampling
Only measure a part of the population
Interview 2,403 Tunisians
Measuring the sample
Sample statistic
(or point estimate)
The population parameter (or estimand), but calculated from a sample of the population
Uses a hat! \widehat{p} = 0.425
Same hat as \widehat{y} in regression: hat = estimate
Parameters and statistics
| Population parameter | Sample statistic | |
|---|---|---|
| Proportion | p | \widehat{p} |
| Mean | \mu | \bar{x} |
| Regression slope | \beta_1 | b_1 or \widehat{\beta}_1 |
Everything you calculate from a sample is an estimate of some unknown population value
Is the sample any good?
- Representative: Does the sample look like the population?
- Unbiased: Did every part of the population have the same chance of being picked?
- Generalizable: Is \widehat{p} a good guess for p?
Random sampling fixes all these
What if we want to save money
and we just run an online survey?
- 33% of Tunisians don’t use the internet
- They’re much less likely to have thought about emigrating
- An online survey only sees internet users: 51% instead of 42%
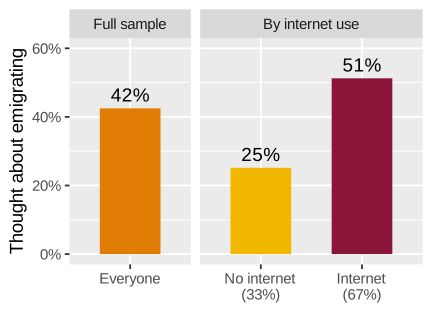
Even if we surveyed a million Tunisians online,
our parameter would be wrong!
M&Ms
M&M colors!
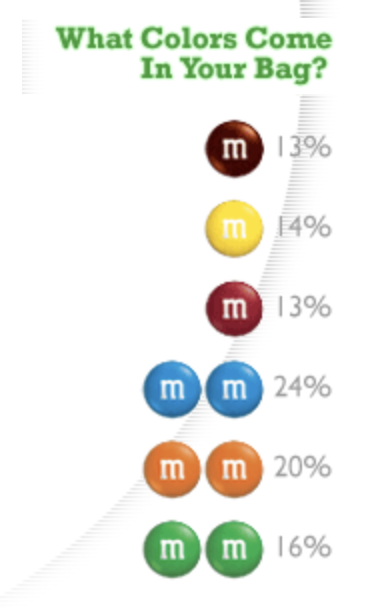
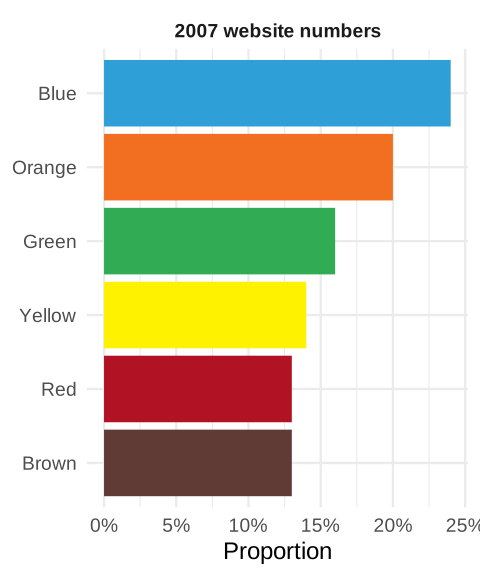
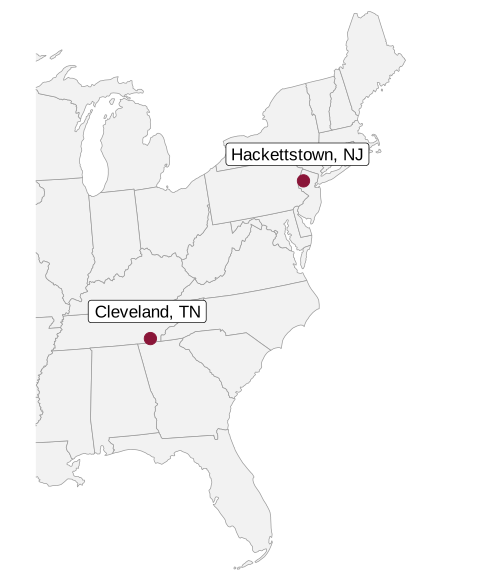
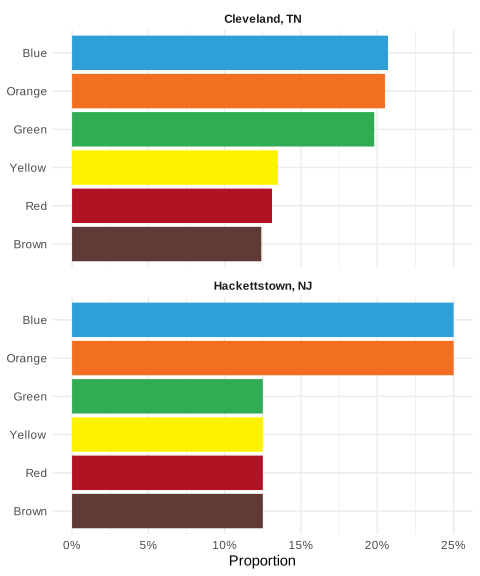
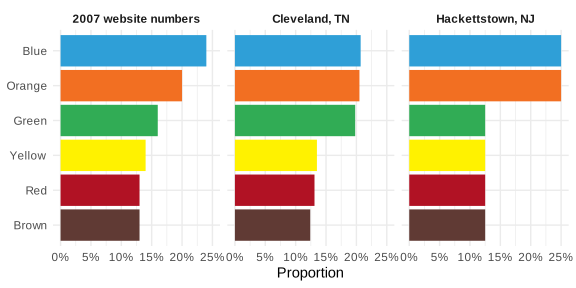
What about Qatar?
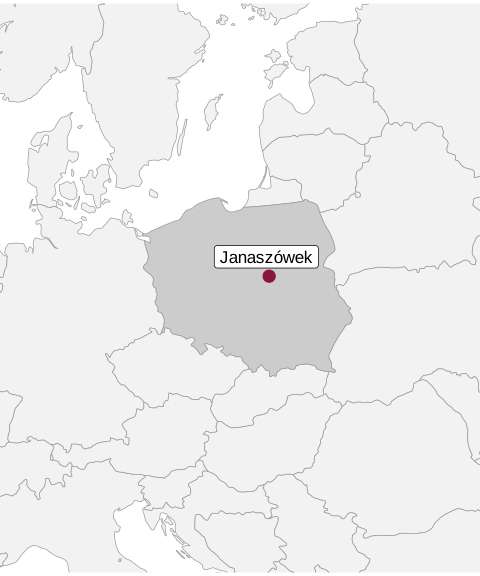
Mars Polska
Your bag is a sample
- Every bag was filled from a giant vat (kind of) of M&Ms at the Mars factory in Janaszówek, Poland
- Each bag has ≈50 M&Ms
- We want to know what the factory makes, but we only have our bags
Define the population
Population
Every plain M&M made in Janaszówek
Population parameter
The proportion of each color in the vat
p_\text{blue}, p_\text{brown}, p_\text{green},
p_\text{orange}, p_\text{red}, p_\text{yellow}
Census or sample?
Census
Count every single M&M made in Poland (ever? on a specific day?)
Impossible!
Sample
Count the M&Ms in one bag
\widehat{p}_\text{green} = green M&Ms in your bag ÷ all M&Ms in your bag
Your turn: count your bag
Don’t eat anything yet!
Count how many M&Ms of each color are in your bag
Calculate \widehat{p} for each color (count ÷ total)
Fill out the form here:
andhs.co/mms
| Color | Count | \widehat{p} |
|---|---|---|
| Blue | ||
| Brown | ||
| Green | ||
| Orange | ||
| Red | ||
| Yellow | ||
| Total | 1.00 |
Is your bag a good sample?
- Representative: Does your bag look like the vat?
- Unbiased: Did every M&M have the same chance of ending up in your bag?
- Generalizable: Is your \widehat{p}_\text{green} a good guess for p_\text{green}?
What could go wrong?
- All our bags came from the same two boxes at Carrefour
- Are our bags a random sample of all bags?
Who’s right?
- Compare your \widehat{p}_\text{green} with your neighbors
- Everyone’s bag gives a different answer
- Nobody did anything wrong!
Every sample is a little different:
sampling variation
Getting a better estimate
- More bags?
- Bigger bags?
- Pool the whole class into one giant sample!
Bigger samples → better estimates
Our class’s estimate
Let’s look at the data!
- Everyone’s \widehat{p}_\text{green}: how spread out are they?
- Pool all our bags into one giant sample
- Compare our pooled \widehat{p}_\text{green} with Cleveland (19.8%), Hackettstown (12.5%), and the 2007 numbers (16%)
What did we find?
- Whose bag was closest to the pooled estimate? Farthest?
- How different were the individual bags from each other?
- Is our pooled estimate closer to one of the US factories?
- Do you trust the pooled estimate more than your own bag? Why?
Plan for today
Sampling variation
Uncertainty
Choosing a sample size
Sampling variation
What our bags taught us
- Every bag gave a different \widehat{p}_\text{green}
- One small bag can be way off
- Pooling all our bags into one big sample gave a much better estimate
- A few big samples beat lots of little ones
Today: why that works and how much better bigger samples are
We can’t buy 1,000 bags
- Our class’s bags give us a rough picture of sampling variation
- To really see it, we’d need thousands of bags
- And we still wouldn’t know the true p_\text{green}!
Computers to the rescue!
Simulation
Make a pretend population where we know the truth, then take lots of random samples from it
- Build a population with a known parameter
- Draw a random sample
- Calculate the statistic (\widehat{p})
- Repeat thousands of times
- Look at all the \widehat{p}s
A virtual vat
1,000 virtual bags
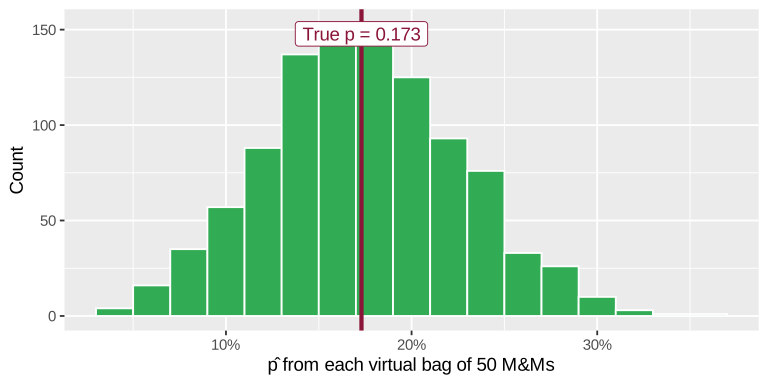
Centered on the truth, but lots of bags are way off—just like our real bags!
Same idea, but with real survey data
Pretend the 2,403 Tunisian respondents are the entire population
We know the true parameter: p = 0.425
What happens if we take random samples of 100 people from this population?
| Sample | Yes | \widehat{p} |
|---|---|---|
| 1 | 40 | 0.4 |
| 2 | 40 | 0.4 |
| 3 | 43 | 0.43 |
| 4 | 44 | 0.44 |
| 5 | 39 | 0.39 |
- Every sample gives a different \widehat{p}
- None of them are exactly 0.425
- That’s fine! It’s just sampling variation
Repeat 1,000 times
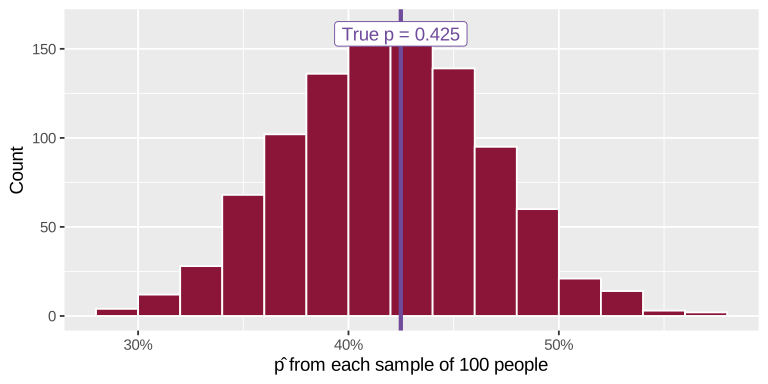
This is a sampling distribution
Sampling distribution
The distribution of a statistic (like \widehat{p}) across lots of random samples of the same size
- Shows how much estimates bounce around from sample to sample
- We can only see it with simulation (or math)
- In real life, you only get one draw from it!
Three different distributions
Population
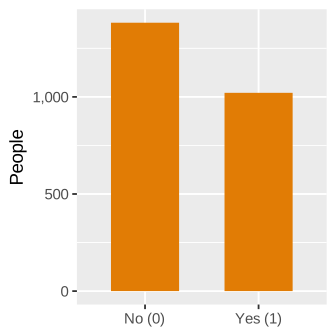
All 2,403 Tunisians’ answers
One sample
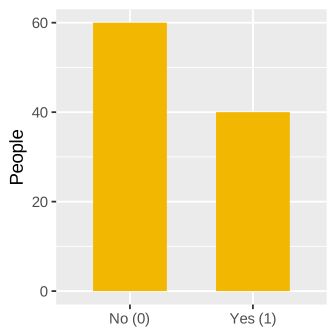
100 people’s answers
(\widehat{p} = 0.4)
Sampling distribution
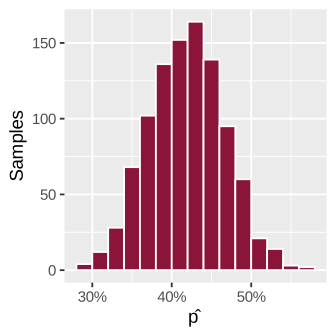
1,000 samples’ \widehat{p}s
Statistics have distributions too!
More samples or bigger samples?
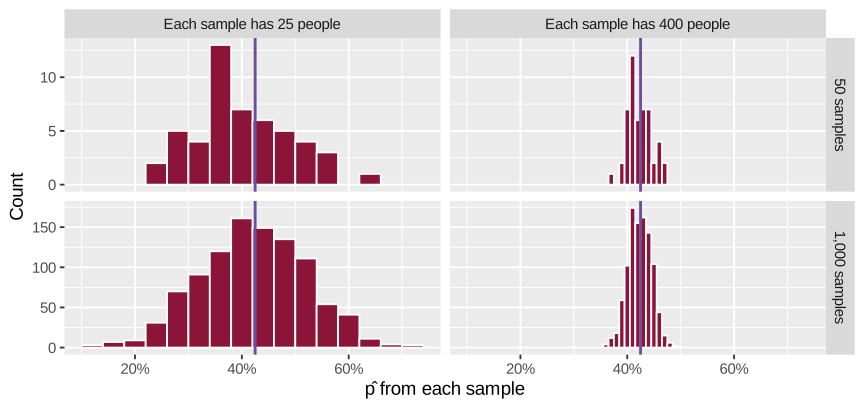
More samples → smoother picture of the same distribution; bigger samples → narrower distribution
Central limit theorem
With random samples, the sampling distribution of a sample proportion (or mean) is approximately normal
- …centered at the population parameter (p)
- …no matter what the population looks like (ours was just 0s and 1s!)
- …as long as the samples are big enough
\widehat{p} \sim \mathcal{N}(p, \text{SE})
It works for averages too
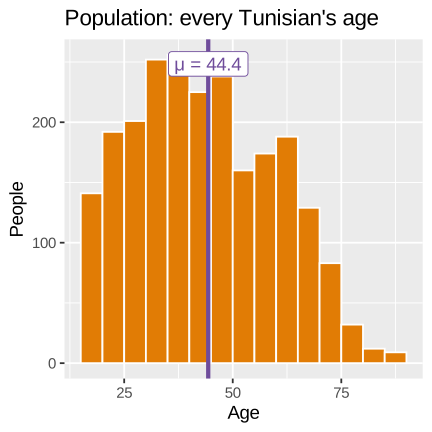
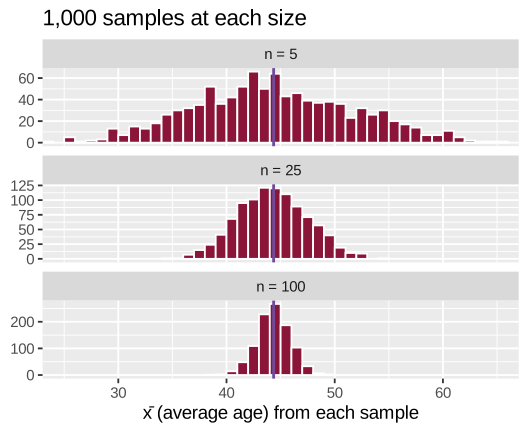
Sample size is important!
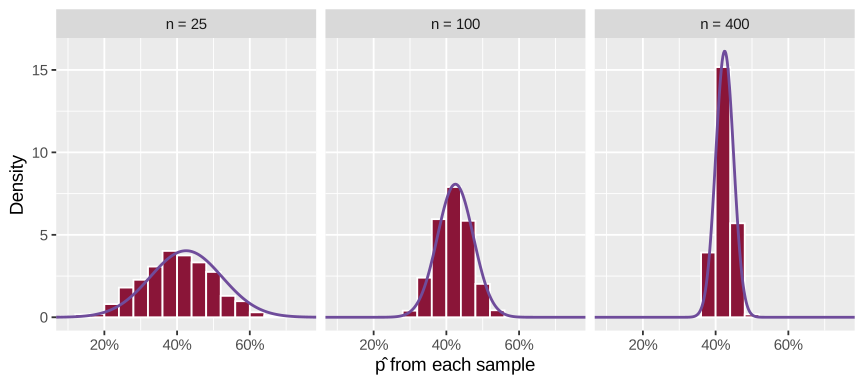
Two kinds of spread
Standard deviation
How much do individual values vary?
How different is one Tunisian from another?
For yes/no data:
\sqrt{p(1 - p)} = 0.494
Standard error
How much do sample statistics vary?
How different is one sample’s \widehat{p} from another’s?
The standard deviation of the sampling distribution
Standard error formula
\text{SE}(\widehat{p}) = \frac{\text{SD}}{\sqrt{n}} = \sqrt{\frac{p (1 - p)}{n}}
| Sample size | SE from 1,000 samples | SE from formula |
|---|---|---|
| 25 | 0.1 | 0.099 |
| 100 | 0.047 | 0.049 |
| 400 | 0.022 | 0.025 |
- The formula matches the simulations!
- Bigger n → smaller SE
- \sqrt{n} means 4× the people → ½ the SE
Bigger samples don’t fix bias
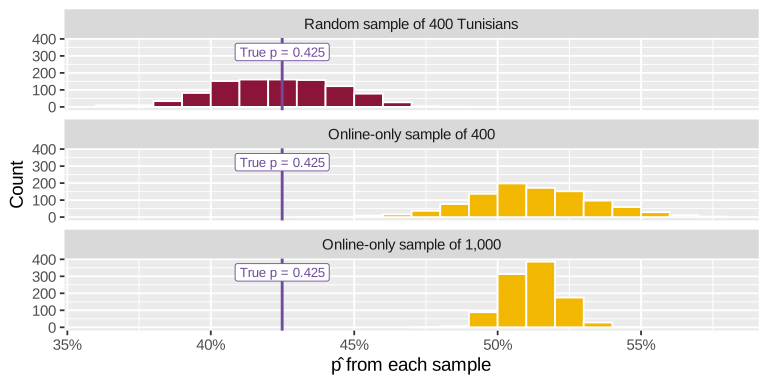
Random sampling puts the center in the right place; sample size controls the width
Uncertainty
Trump’s approval rating is 34.9% (+/-2.1% pts.)
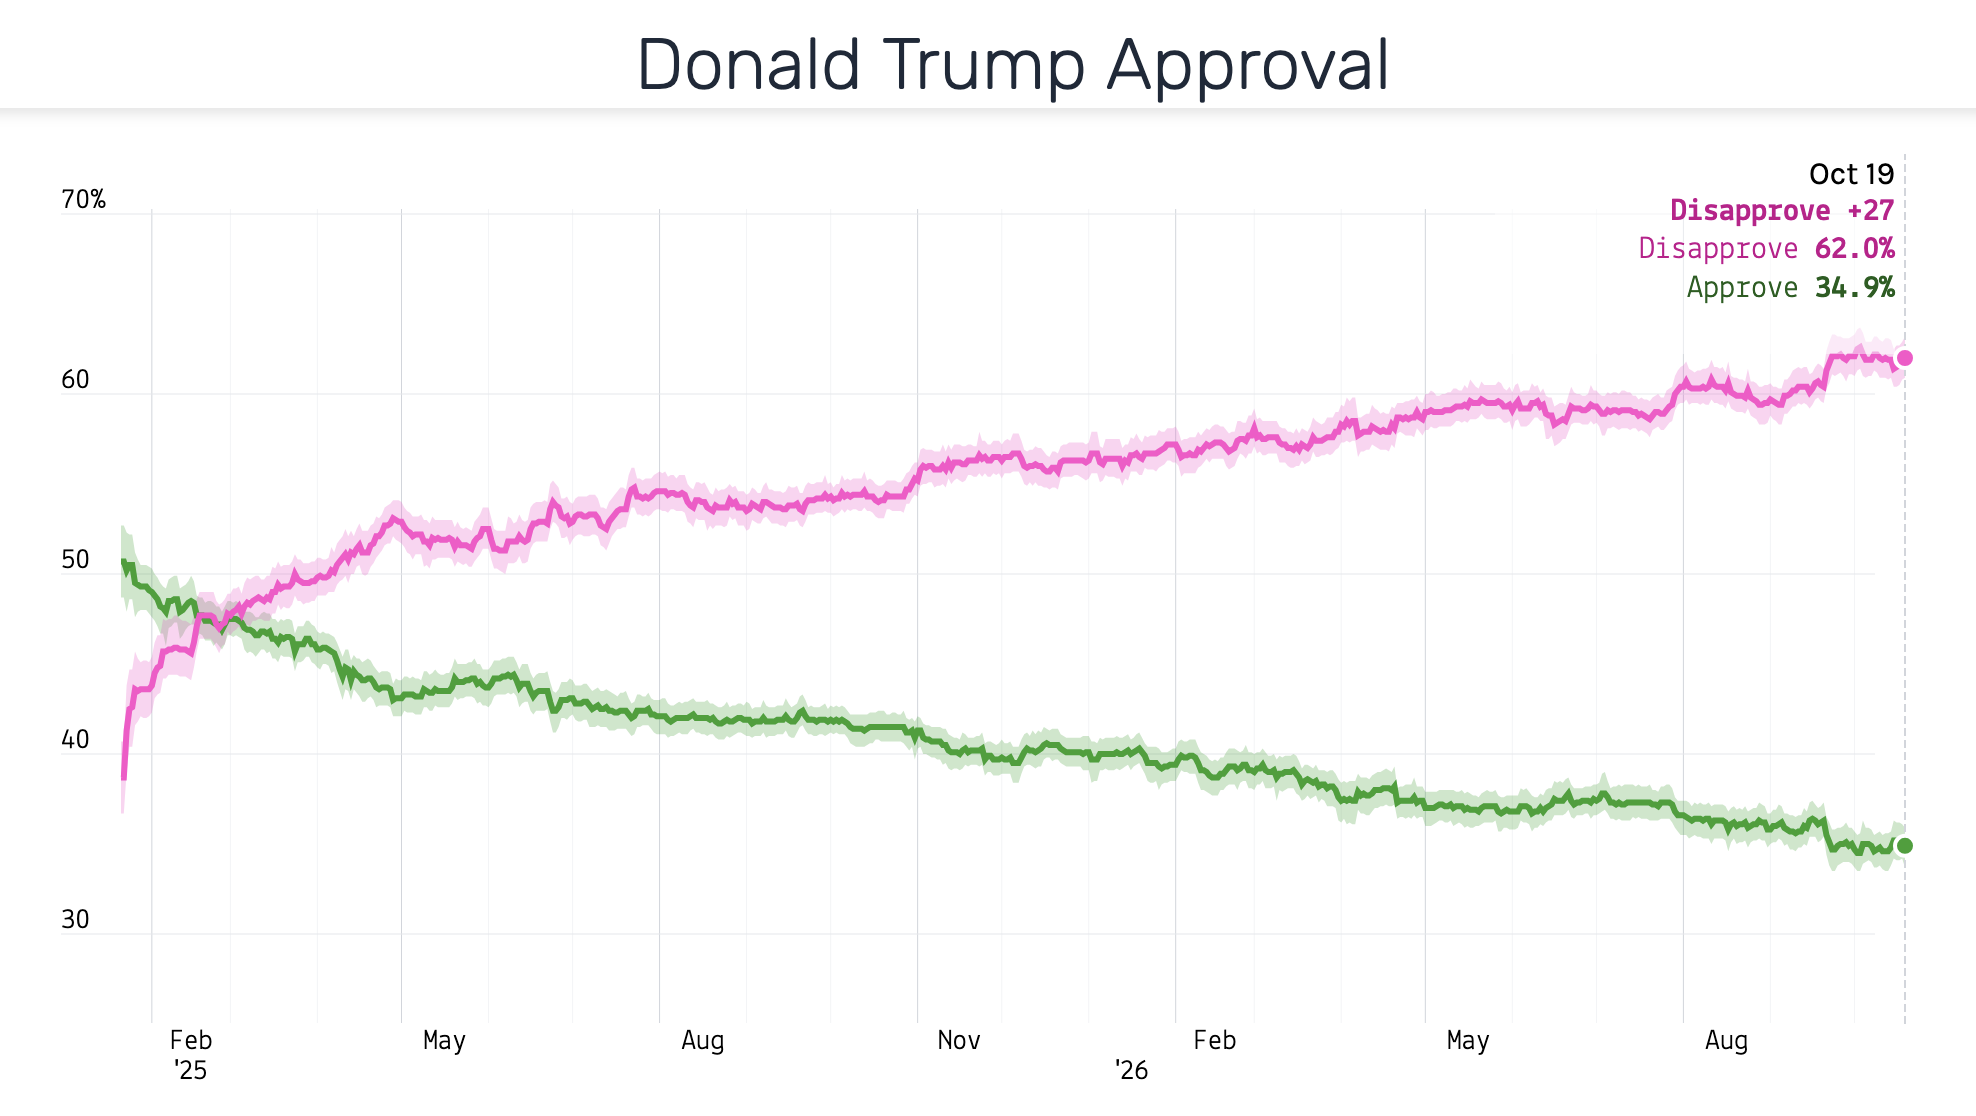
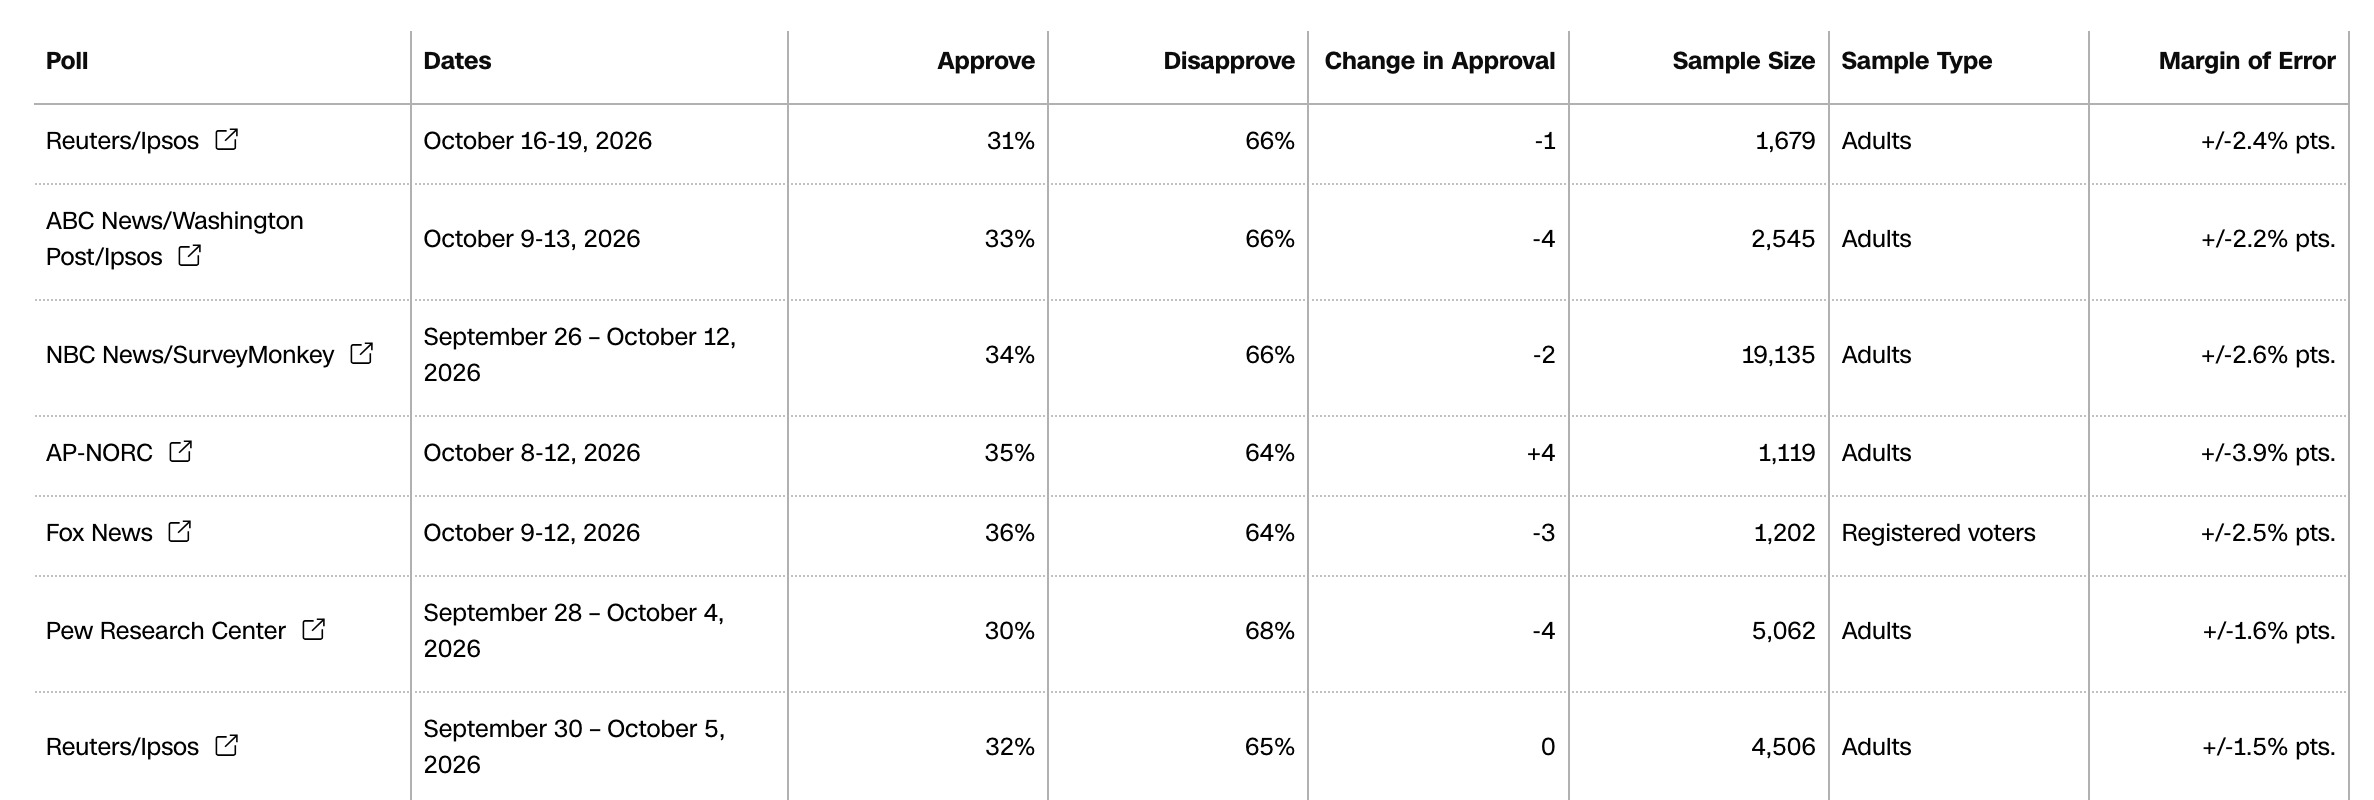
How accurate is the estimate?
- In real life we only get one sample
- We can’t see the whole sampling distribution—we don’t know the true population parameter
- But the CLT tells us what the sampling distribution looks like…
Normal curves have rules
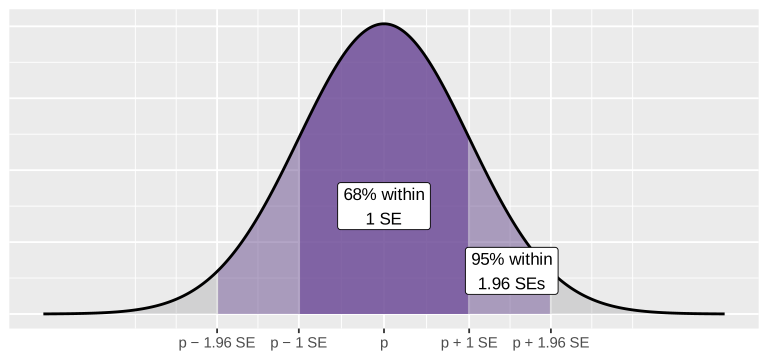
Our 1,000 samples of 100: 70% within 1 SE of p; 96.5% within 1.96 SEs
Flip it around
- 95% of \widehat{p}s are within 1.96 SEs of p
- So if we reach 1.96 SEs out from our \widehat{p} in both directions, we’ll catch the true p in 95% of samples
Margin of error
How far to reach
\text{MOE} = 1.96 \times \text{SE}
(≈ 2 × SE)
Confidence interval
The range you get
\widehat{p} \pm \text{MOE}
(a 95% confidence interval)
\text{SE} \approx \sqrt{\frac{\widehat{p} (1 - \widehat{p})}{n}}
40 out of 100 Tunisians have thought about emigrating
- \widehat{p} = 0.4
- \text{SE} \approx \sqrt{\frac{0.4 \times 0.6}{100}} = 0.049
- \text{MOE} = 1.96 \times 0.049 = 0.096
- 40% ± 9.6 points → 30.4% to 49.6%
The true p (42.5%) is in there!
\text{SE} \approx \sqrt{\frac{\widehat{p} (1 - \widehat{p})}{n}}
400 out of 1,000 Tunisians have thought about emigrating
- \widehat{p} = 0.4
- \text{SE} \approx \sqrt{\frac{0.4 \times 0.6}{1000}} = 0.0155
- \text{MOE} = 1.96 \times 0.0155 = 0.0304
- 40% ± 3.0 points → 37.0% to 43.0%
The true p (42.5%) is still in there!
(but now the estimate is narrower and more precise)
100 samples, 100 intervals
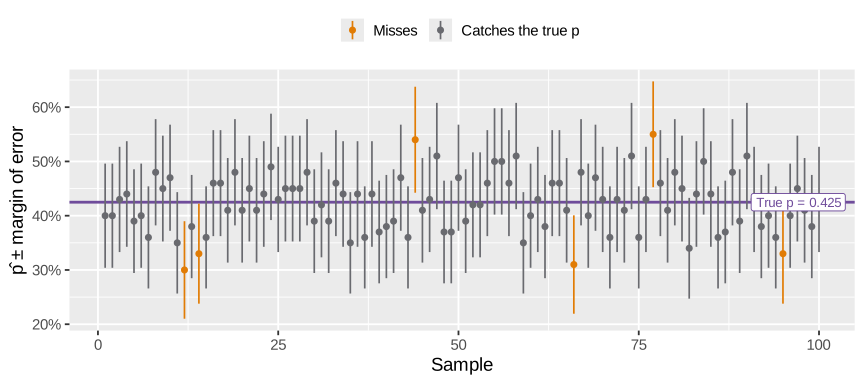
94 of these 100 intervals include the true p
What does “95% confidence” mean?
- If we took sample after sample and made an interval each time, about 95% of those intervals would include the true p
- The 95% describes the method, not any single interval
- Our one interval either caught p or it didn’t—we just can’t know which
- Bigger samples → narrower intervals, but still 95% of them catch the truth
Much more about confidence intervals in ModernDive chapter 8!
Back to the poll
Trump’s approval rating is 34.9% (+/-2.1% pts.)
- Point estimate: \widehat{p} = 34.9%
- Margin of error: ± 2.1 points
- 95% confidence interval: 32.8% to 37.0%
Approval is plausibly anywhere from about 33% to 37%
MOE isn’t perfect
The margin of error only measures sampling variation, not these:
- Biased samples (online-only surveys!)
- Non-response
- People who refuse to answer
- Confusing or leading questions
- People who lie or give the “polite” answer
Emigration, with margins of error
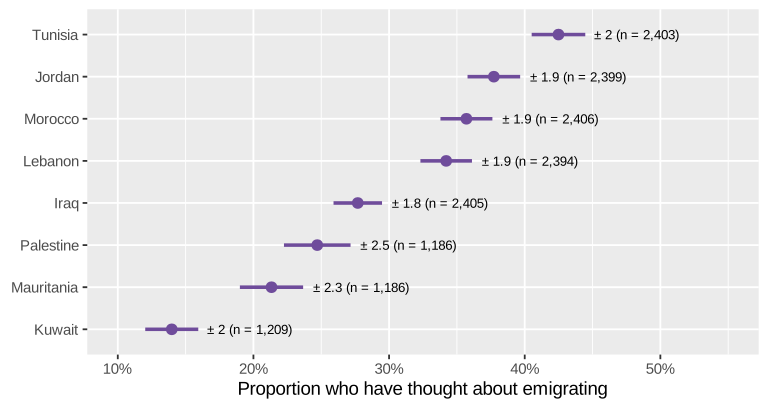
Our M&Ms, with a margin of error
Back to Positron!
- Calculate the SE and margin of error for your own bag’s \widehat{p}_\text{green}
- Calculate the SE and margin of error for the class’s pooled \widehat{p}_\text{green}
- Which one is more useful? Why?
Choosing a
sample size
How many people do we need?
It depends on three things
- Precision: How big of a margin of error can you live with?
- Confidence: How sure do you want to be? (95% → 1.96)
- Variability: How spread out are the answers? (p(1 - p))
Notice what’s not on the list: how big the population is!
Flip the formula
\text{MOE} = 1.96 \times \sqrt{\frac{p (1 - p)}{n}} \quad \rightarrow \quad n = \frac{1.96^2 \times p (1 - p)}{\text{MOE}^2}
- But we don’t know p before we survey anyone!
- Play it safe: p(1 - p) is biggest when p = 0.5
- That gives you the biggest (worst-case) sample size
Example: ± 3 points
- We want a margin of error of 3 percentage points (0.03)
- Assume the worst: p = 0.5
- n = \frac{1.96^2 \times 0.5 \times 0.5}{0.03^2} = \frac{0.9604}{0.0009} = 1,067.1
- Always round up: 1,068 people
That’s why so many polls survey ≈1,000 people
Quick rule of thumb
1.96^2 \times 0.5 \times 0.5 \approx 1, so:
Margin of error from n
\text{MOE} \approx \frac{1}{\sqrt{n}}
n = 1,000 → \frac{1}{\sqrt{1000}} = ± 3.2 points
n from margin of error
n \approx \frac{1}{\text{MOE}^2}
± 3 points → \frac{1}{0.03^2} ≈ 1,111 people
Precision is expensive
| Margin of error | People needed | Cost at QAR 50 per interview |
|---|---|---|
| ± 10 points | 97 | QAR 4,850 |
| ± 5 points | 385 | QAR 19,250 |
| ± 3 points | 1,068 | QAR 53,400 |
| ± 2 points | 2,401 | QAR 120,050 |
| ± 1 points | 9,604 | QAR 480,200 |
Cut the margin of error in half → 4× the people
Diminishing returns
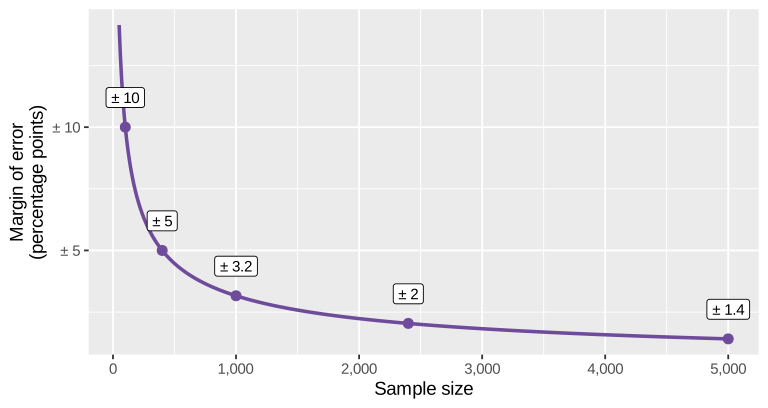
Most national surveys stop at ≈1,000–2,500 people
Population size doesn’t matter
- ± 3 points needs ≈1,068 people in Qatar (≈3 million), Tunisia (≈12 million), or the United States (≈340 million)
- Soup!
Subgroup sizes
- All Tunisians (n = 2,403): 42% have thought about emigrating, ± 2 points
- Young Tunisians, 18–29 (n = 482): 70%, ± 4.1 points
- Want ± 3 points for young people? You need ≈1,068 young people
Plan your sample size around the smallest group you care about
Surveys often oversample small groups (and use weights to fix the overall results)
Using what you already know
- p = 0.5 is the worst case
- If past surveys (or M&M bags!) tell you p is around 0.17, use that instead
- 0.5 \times 0.5 = 0.25, but 0.17 \times 0.83 ≈ 0.14
- ± 3 points with p = 0.17: 603 people instead of 1,068
Your turn: how many M&Ms?
Assume p_\text{green} ≈ 0.17 (our class’s estimate) and each bag has ≈50 M&Ms
n = \frac{1.96^2 \times p (1 - p)}{\text{MOE}^2}
- How many M&Ms do you need to estimate p_\text{green} within ± 5 points? How many bags is that?
- How many M&Ms for ± 2 points? How many bags?
- How many bags did our class have? Was that enough?
How many M&Ms?
- ± 5 points: \frac{1.96^2 \times 0.17 \times 0.83}{0.05^2} = 217 M&Ms ≈ 5 bags
- ± 2 points: \frac{1.96^2 \times 0.17 \times 0.83}{0.02^2} = 1,356 M&Ms ≈ 28 bags
One bag can’t tell the factories apart—but a whole class can!
Beyond proportions
- Means: n = \left(\frac{1.96 \times \sigma}{\text{MOE}}\right)^2
- Need a guess for the standard deviation \sigma (from past studies or a small pilot survey)
- Differences and regression slopes: “power analysis”
- How many people do I need to detect an effect of a certain size?
- Often easiest to figure out with simulation—the same trick we used today!