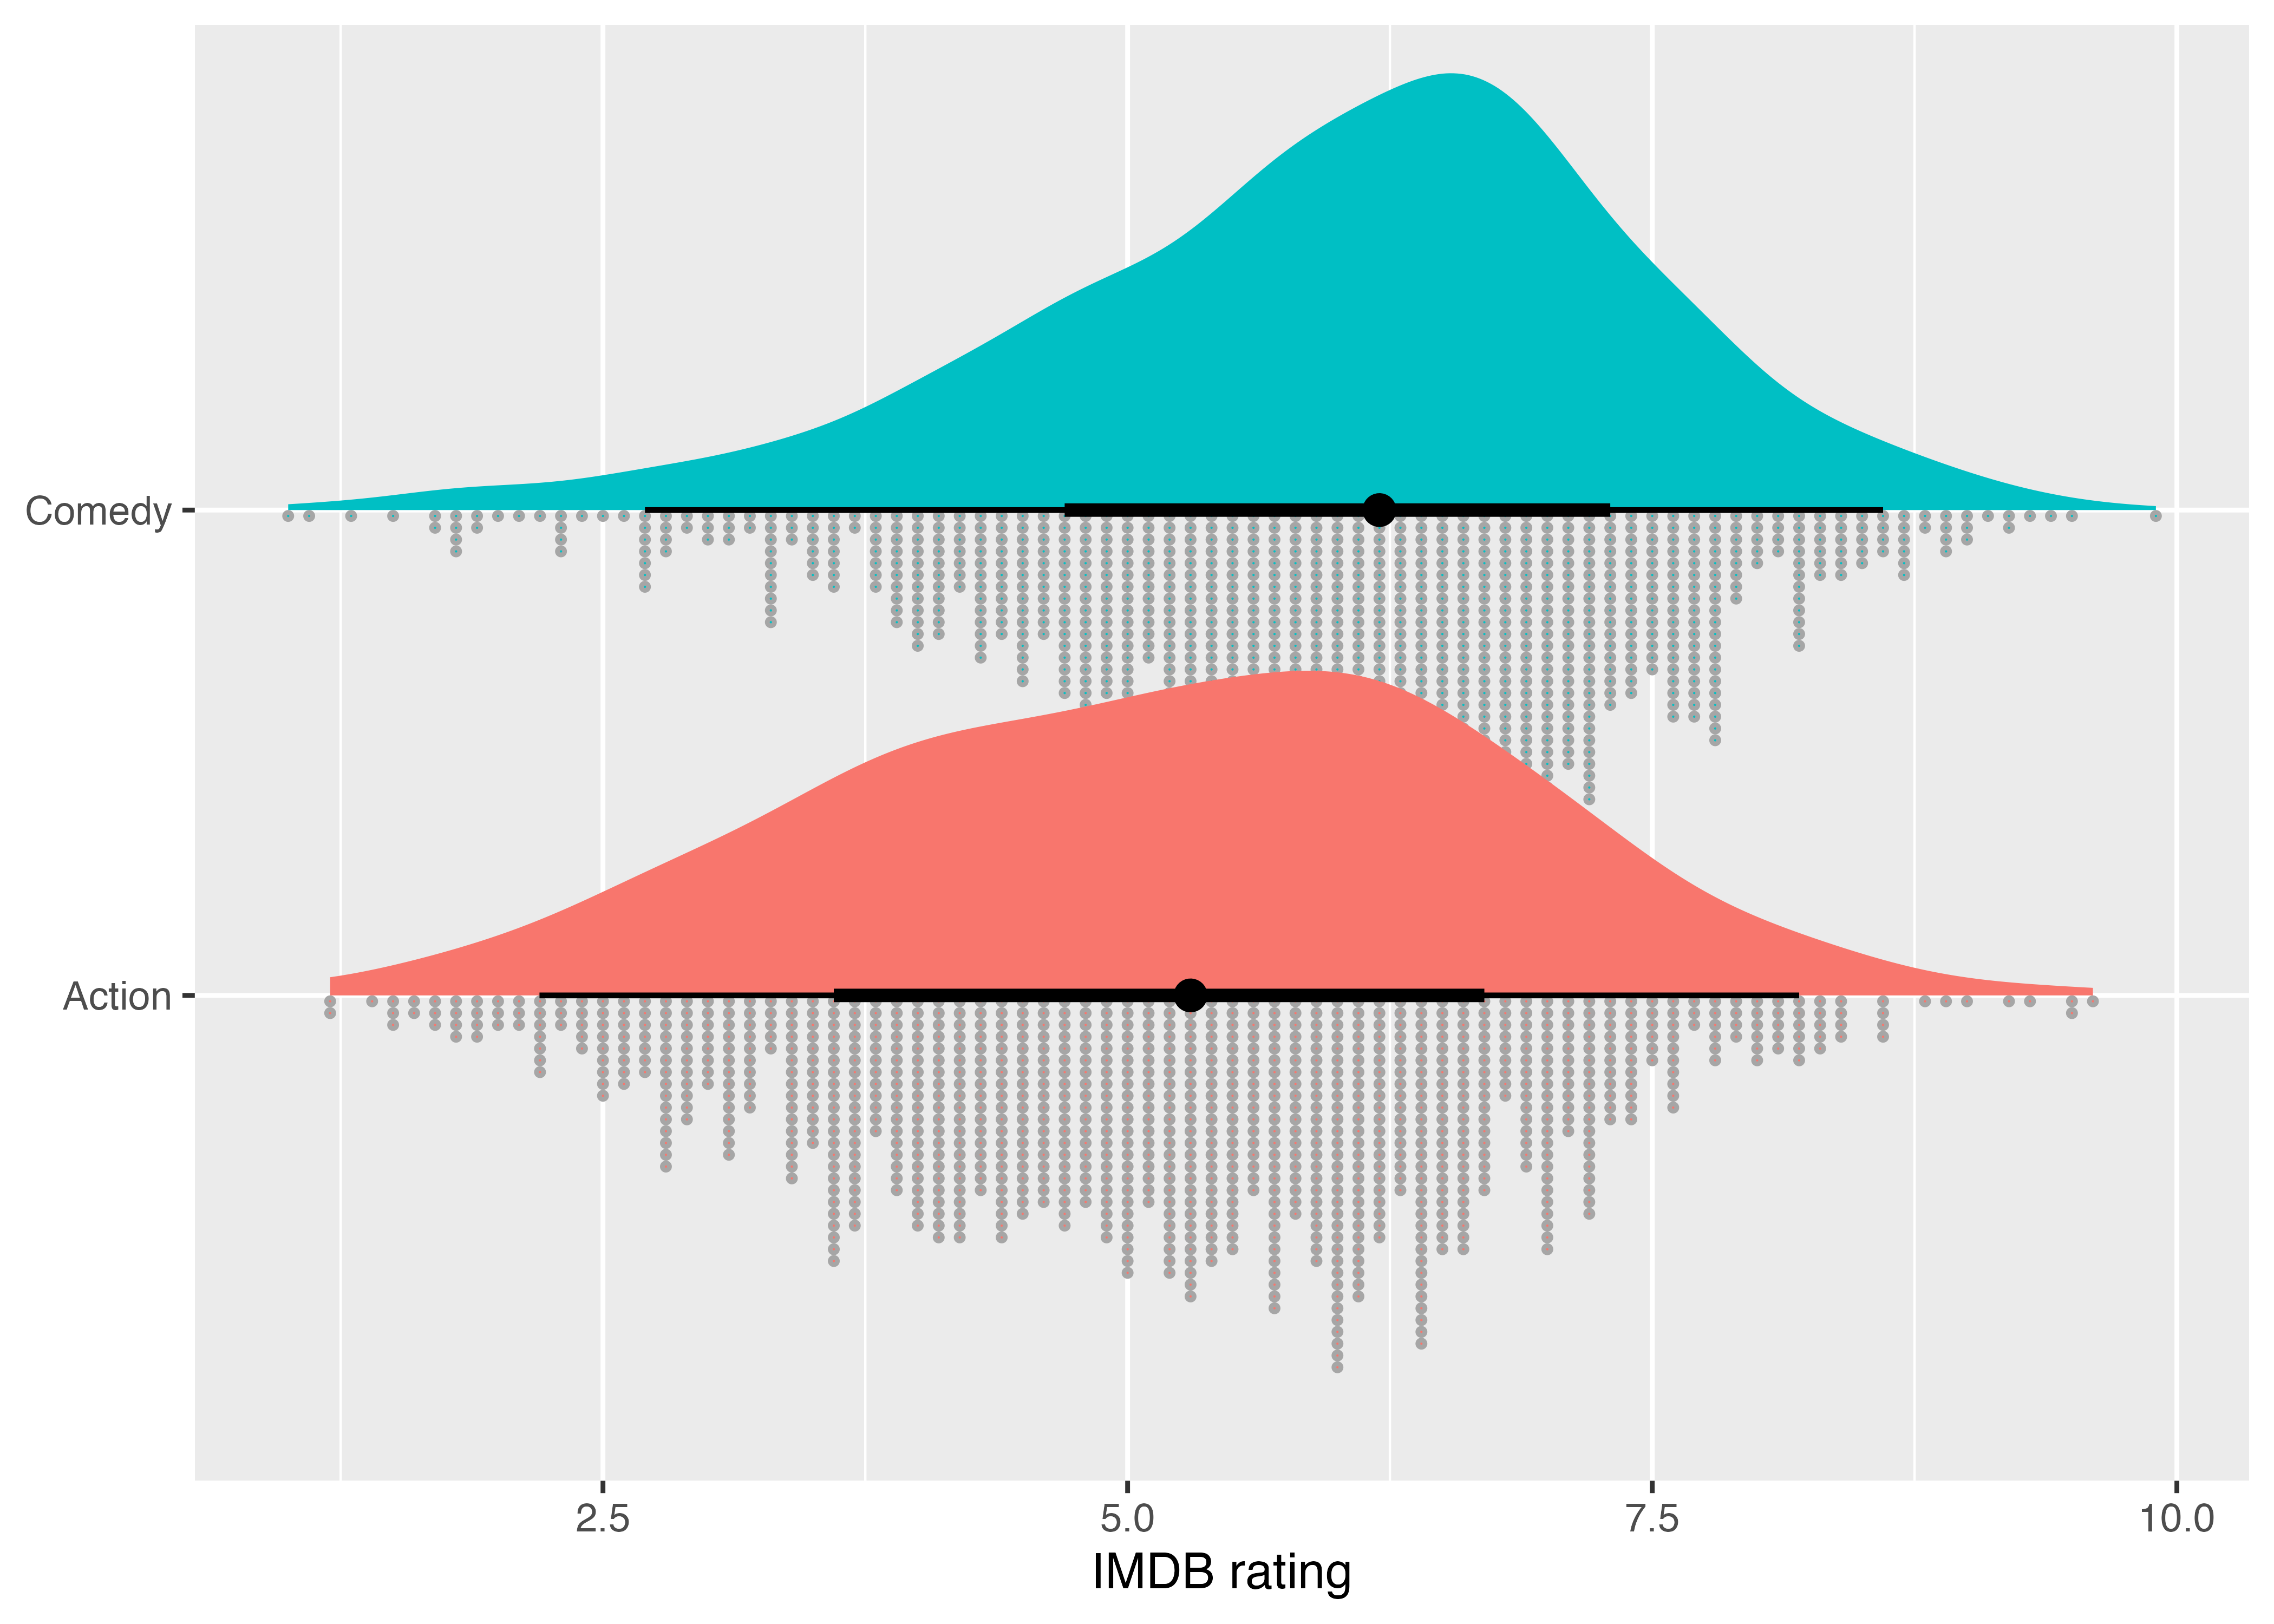
library(tidyverse)
library(ggplot2movies)
library(ggdist)

set.seed(1234)  # Set seed so we get the same sampled rows every time

movies_clean <- movies |>
  select(title, year, rating, Action, Comedy) |>
  filter(!(Action == 1 & Comedy == 1)) |>
  mutate(
    genre = case_when(
      Action == 1 ~ "Action",
      Comedy == 1 ~ "Comedy",
      TRUE ~ "Neither"
    )
  ) |>
  filter(genre != "Neither") |>
  mutate(genre = factor(genre)) |>
  select(-Action, -Comedy) |>
  # Randomly select 100 movies in each genre
  group_by(genre) |>
  sample_n(1000) |>
  ungroup()

movies_clean |>
  group_by(genre) |>
  summarize(avg_rating = mean(rating))